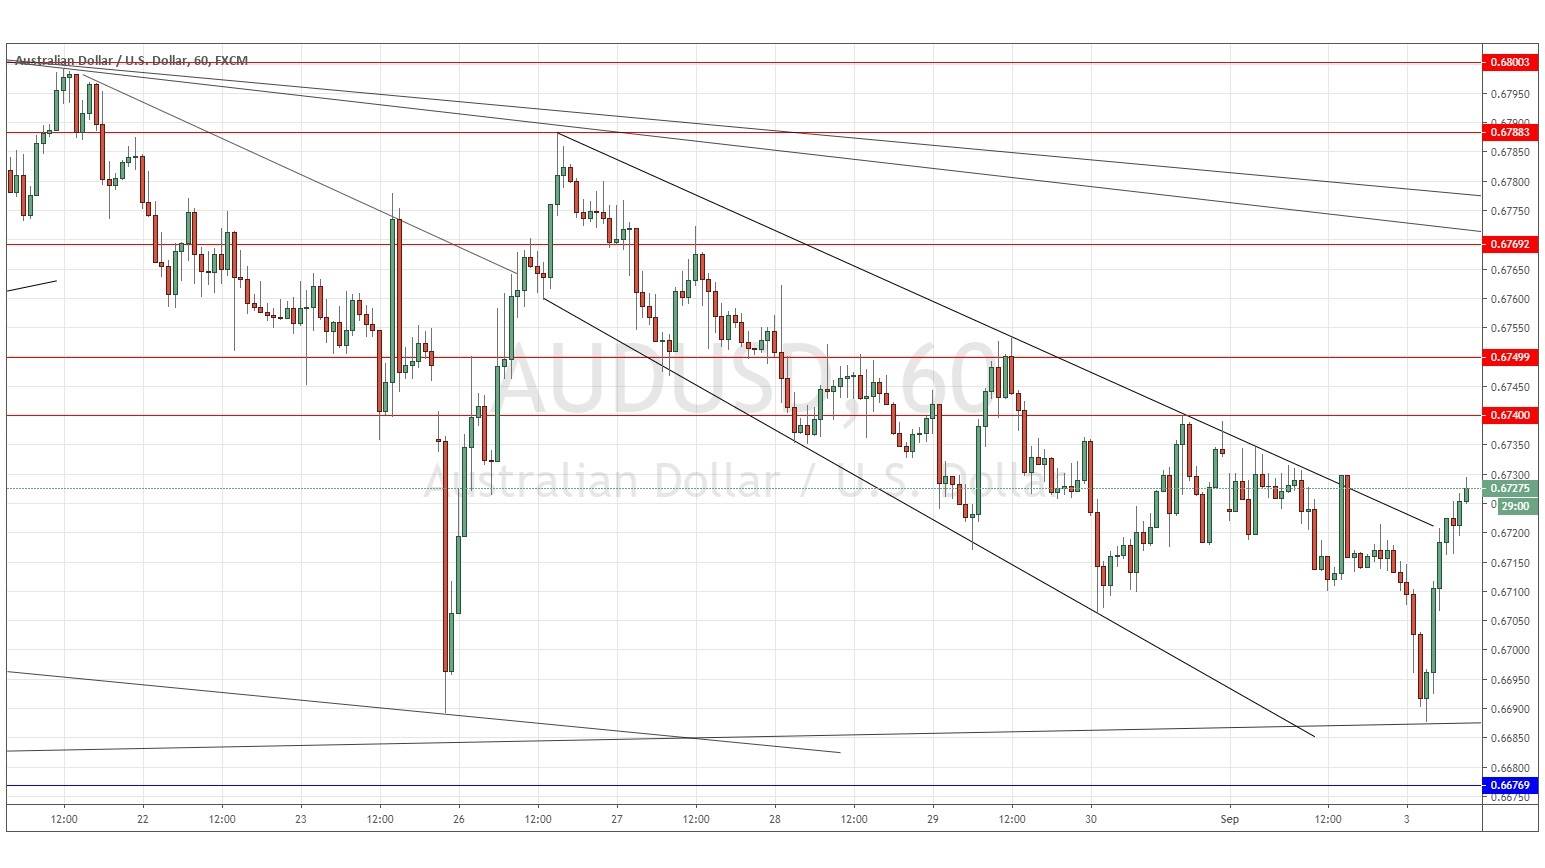
AUDUSD: Bullish inner trend line break?
Yesterday’s signals were not triggered, as none of the key levels were ever reached.
Today’s AUD/USD Signals
Risk 0.75%.
Trades may only be entered before 5pm Tokyo time Wednesday.
Short Trade Ideas
Go short following bearish price action on the H1 time frame immediately upon the next touch of 0.6740, 0.6750, and 0.6769.
Put the stop loss 1 pip above the local swing high.
Adjust the stop loss to break even once the trade is 20 pips in profit.
Remove 50% of the position as profit when the trade is 20 pips in profit and leave the remainder of the position to ride.
Long Trade Idea
Go long following bullish price action on the H1 time frame immediately upon the next touch of 0.6677.
Put the stop loss 1 pip below the local swing low.
Adjust the stop loss to break even once the trade is 20 pips in profit.
Remove 50% of the position as profit when the trade is 20 pips in profit and leave the remainder of the position to ride.
The best method to identify a classic “price action reversal” is for an hourly candle to close, such as a pin bar, a doji, an outside or even just an engulfing candle with a higher close. You can exploit these levels or zones by watching the price action that occurs at the given levels.
AUD/USD Analysis
I wrote yesterday that the picture was looking much more solidly bearish, with a symmetrical bearish price channel which seemed poised to push the price down from 0.6730. I thought that it was hard to see how the price was not going to descend to the 0.6700 area at least. However, I noted that there was a major data release due later concerning the AUD which could push the price around in a very unpredictable way.
This was a good call as the price did descend until the big release from the Australian central bank (the RBA), which left the cash rate unchanged at 1.00% and boosted the Australian Dollar considerably with a rise which is still ongoing to new highs on the shorter-term charts. We have seen a break over the past few hours above the upper trend line of the bearish channel which is a bullish sign. We also have a long to medium-term triple bottom at the 0.6690 area, which suggests that the price may find it difficult to get meaningfully lower than this. However, on the other hand, there is a lot of resistance within the 75 pips above the current price, and it is hard to see much of this area being broken to the upside.
Therefore, I would still have a bias towards taking short trades at 0.6740 or any of the resistance levels up to 0.6800, but I would be looking to take profit before 0.6700 is reached. Regarding the USD, there will be a release of ISM Manufacturing PMI data at 3pm London time. Concerning the AUD, there will be a release of GDP data at 2:30am.
