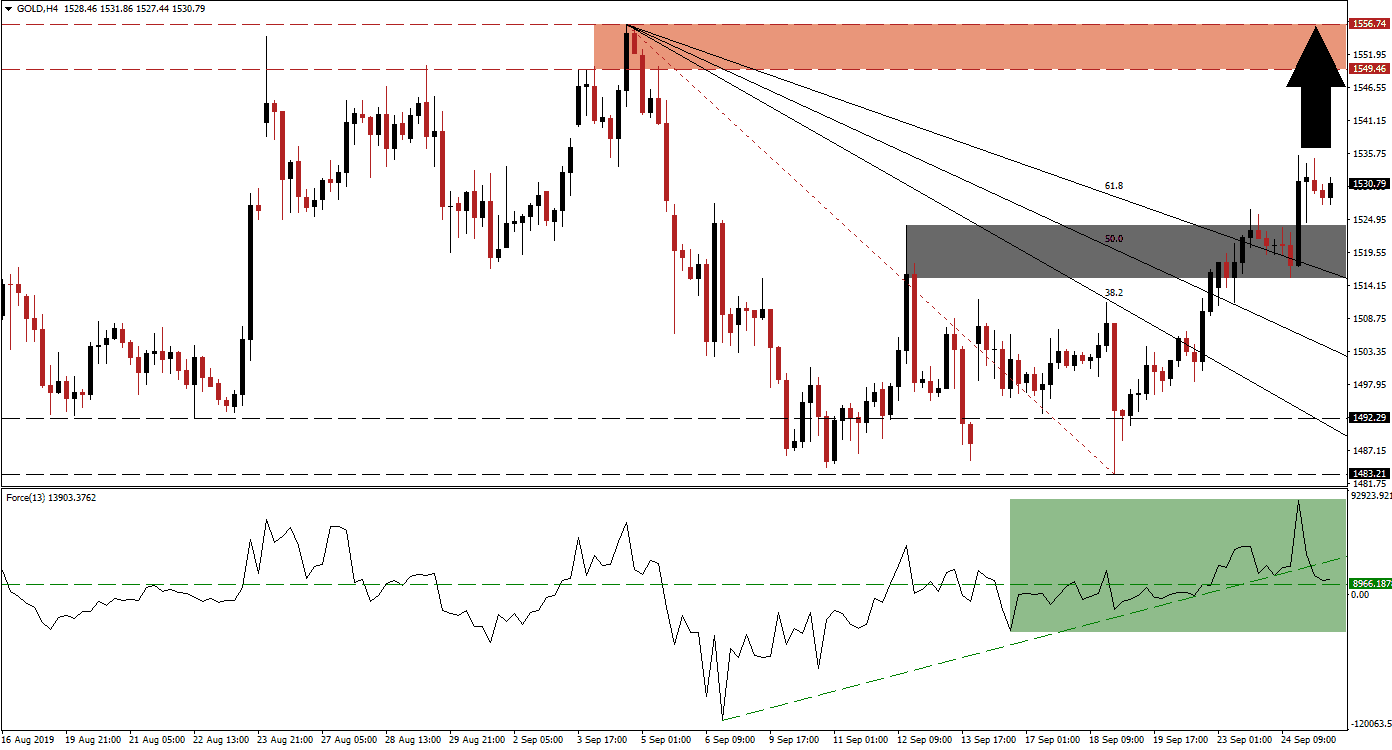
The increase in geopolitical risk has once again boosted demand for gold. As the global economy is slipping closer to a recession, safe haven demand for this precious metal has steadily increase throughout 2019. Interest rate cuts as well as central bank buying further boosted price action. This led to a breakout above its long-term support zone and the build-up in bullish momentum carried gold through its entire Fibonacci Retracement Fan sequence, turning it from resistance into support. Gold previously entered a sell-off after the US and China agreed to a fresh round of trade talks which prompted profit taking by traders.
The Force Index, a next generation technical indicator, has marched higher as price action moved through its long-term support zone. The rise in volatility over the past two weeks didn’t violate the uptrend and the Force Index confirmed the higher high in gold with a higher high of its own. After this precious metal completed a breakout above its 61.8 Fibonacci Retracement Fan Resistance Level, turning it into support, price action took a breather before a fresh spike higher. At the same time the Force Index lost momentum and retreated back down to its horizontal support level which took this technical indicator below its ascending support level; this is marked by the green rectangle. You can learn more about the Fibonacci Retracement Fan, the Force Index and the Support Zone here.
A pause following a series of breakouts above key resistance levels is normal while price action will test its new support levels. As long as the Force Index can maintain its position in positive territory while gold remains above its 61.8 Fibonacci Retracement Fan Support Level, the uptrend has more upside potential. The intra-day low of 1,515.50 should be monitored if gold enters a short-term reversal. This level represents a previous low following the initial breakout above its 61.8 Fibonacci Retracement Fan Resistance Level and reversal below it, which turned it into support. It also marks the bottom range of its short-term support zone , with the top range located at 1,523.92 as marked by the grey rectangle.
The current global fundamental scenario favors an extension of the breakout in gold which can take price action back into its resistance zone. This zone is located between 1,549.46 and 1,556.74 as marked by the red rectangle. Given the global risk profile, a breakout above this level is likely, if the Force Index will eclipse its most recent peak while gold extends its rally. A move above the intra-day high of 1,535.44, the top of its current advance, is likely to attract more net buy orders in gold which will push price action into its resistance zone. You can learn more about a Breakout, a Breakdown and the Resistance Zone here.
Gold Technical Trading Set-Up - Breakout Extension Scenario
Long Entry @ 1,527.50
Take Profit @ 1,556.50
Stop Loss @ 1.514.00
Upside Potential: 2,900 pips
Downside Risk: 1,350 pips
Risk/Reward Ratio: 2.15
A sustained breakdown in the Force Index below its horizontal support level, followed by a breakdown in gold below its descending 61.8 Fibonacci Retracement Fan Support Level could lead to a sell-off in this precious metal. This could take price action back down into its long-term support zone which is located between 1,483.21 and 1,492.29. This should be considered a good long-term buying opportunity as more downside is unlikely unless a fundamental catalyst, such as a trade deal between the US and China, emerges.
Gold Technical Trading Set-Up - Limited Breakdown Scenario
Short Entry @ 1,511.00
Take Profit @ 1,492.50
Stop Loss @ 1,520.00
Downside Potential: 1,850 pips
Upside Risk: 900 pips
Risk/Reward Ratio: 2.06

