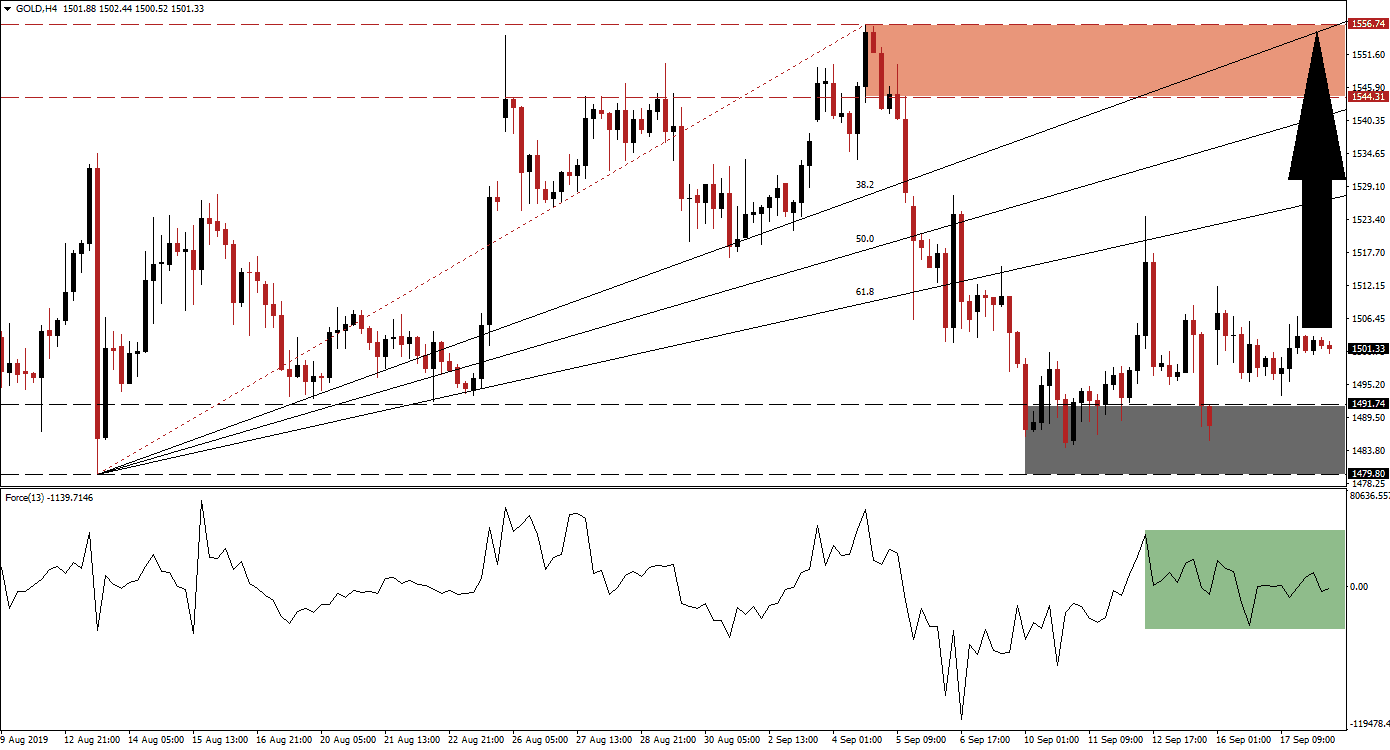
Gold paused its strong rally after positive developments in regards to the US-China trade war prompted a delay in fresh tariffs as well as the temporary exemption on certain items. This resulted in a sharp sell-off as trader booked floating trading profits. Given the preceding strength of the advance, the sell-off was equally powerful and resulted in a breakdown below the entire Fibonacci Retracement Fan Support Sequence, turning it into resistance. Following a brief drop into its long-term support zone, gold spiked back into its ascending 61.8 Fibonacci Retracement Fan Resistance Level before collapsing into its support zone once again which was followed by a new breakout.
What is the Fibonacci Retracement Fan?
The Fibonacci Retracement Fan is a different visualization of the Fibonacci retracement sequence which outlines important support and resistance levels in technical analysis. Those levels warrant a closer look and offer entry and exit levels for trades together with other aspects of the analysis.
The Force Index, a next generation technical indicator, supported the volatile moves. Prior to the first breakout above its support zone a positive divergence formed, signalling the end of the sell-off in gold. The Force Index then eclipsed the 0 center line before contracting back below it, but the uptrend remains intact. Following the most recent intra-day high of 1,523.92, the Force Index peaked and reversed together with price action; this is marked by the green rectangle. As gold is trading above-and-beyond the psychological 1,500 mark, the Force Index should be monitored closely as its direction could precede the next move in price action.
What is the Force Index?
The force index is considered a next generation technical indicator. As the name suggests, it measures the force behind a move. In other words, forex traders will get a better idea behind the strength of bullish or bearish pressures which are driving price action. The indicator consist of three components (directional change of the price, the degree of the change and the trading volume). This creates an oscillator which in conjunction with other aspects of technical analysis provides a good indicator for potential changes in the direction of price action. It subtracts the previous day closing price from today’s closing price and multiplies it by the volume. Strong moves are supported by volume and create the most accurate trading signals.
The breakout-reversal-breakout in gold in-and-out of its support zone, located between 1,479.80 and 1,491.74 which is marked by the grey rectangle, resulted in a series of higher lows which represents a strong bullish development. A recovery in the Force Index above 0 with gold maintaining its position above 1,500 is expected to push this metal back above its 61.8 Fibonacci Retracement Fan Resistance Level. Since this is an ascending resistance level, it would also result in a higher high above its previous intra-day high of 1,523.92 from where bullish pressure is likely to follow. The intra-day low of 1,493.23, located just above its support zone, is a key level to watch for a sustained uptrend.
What is a Support Zone?
A support zone is a price range where bearish momentum is receding and bullish momentum is advancing. They can identify areas where price action has a chance to reverse to the upside and a support zone offers a more reliable technical snapshot than a single price point such as an intra-day low.
An advance above its intra-day high of 1,523.92 and above its 61.8 Fibonacci Retracement Fan Resistance Level is expected to extend the rally into its next resistance zone. This zone is located between 1,544.31 and 1,556.74 and marked by the red rectangle. The top range also represents the current peak of the strong rally in gold and the 38.2 Fibonacci Retracement Fan Resistance Level has just move above it which suggests that more upside is possible. There are plenty of fundamental catalysts, one being central bank buying, which can result in new highs.
What is a Resistance Zone?
A resistance zone is a price range where bullish momentum is receding and bearish momentum is advancing. They can identify areas where price action has a chance to reverse to the downside and a resistance zone offers a more reliable technical snapshot than a single price point such as an intra-day high.
Gold Technical Trading Set-Up - Breakout Extension Scenario
Long Entry @ 1,500.00
Take Profit @ 1,555.00
Stop Loss @ 1.477.00
Upside Potential: 5,500 pips
Downside Risk: 2,300 pips
Risk/Reward Ratio: 2.39
The current fundamental as well as technical picture makes a breakdown highly unlikely and any short-term move lower should be viewed as a great buying opportunity. The support zone is expected to hold any bearish attempt and with downside pressure on the US Dollar, gold is likely to ascend further; gold and the US Dollar often enjoy an inverse relationship since this metal is priced in the US currency. The downside limit of an unlikely breakdown may be the intra-day low of 1,456.53 from where price action pushed through the first breakout above its current support zone.
What is a Breakdown?
A breakdown is the opposite of a breakout and occurs when price action moves below a support or resistance zone. A breakdown below a resistance zone could suggest a short-term move such as profit taking by forex traders or a long-term move such as a trend reversal from bullish to bearish. A breakdown below a support zone indicates a strong bearish trend and the extension of the downtrend.
Gold Technical Trading Set-Up - Limited Breakdown Scenario
Short Entry @ 1,474.00
Take Profit @ 1,457.00
Stop Loss @ 1,482.00
Downside Potential: 1,700 pips
Upside Risk: 800 pips
Risk/Reward Ratio: 2.13

