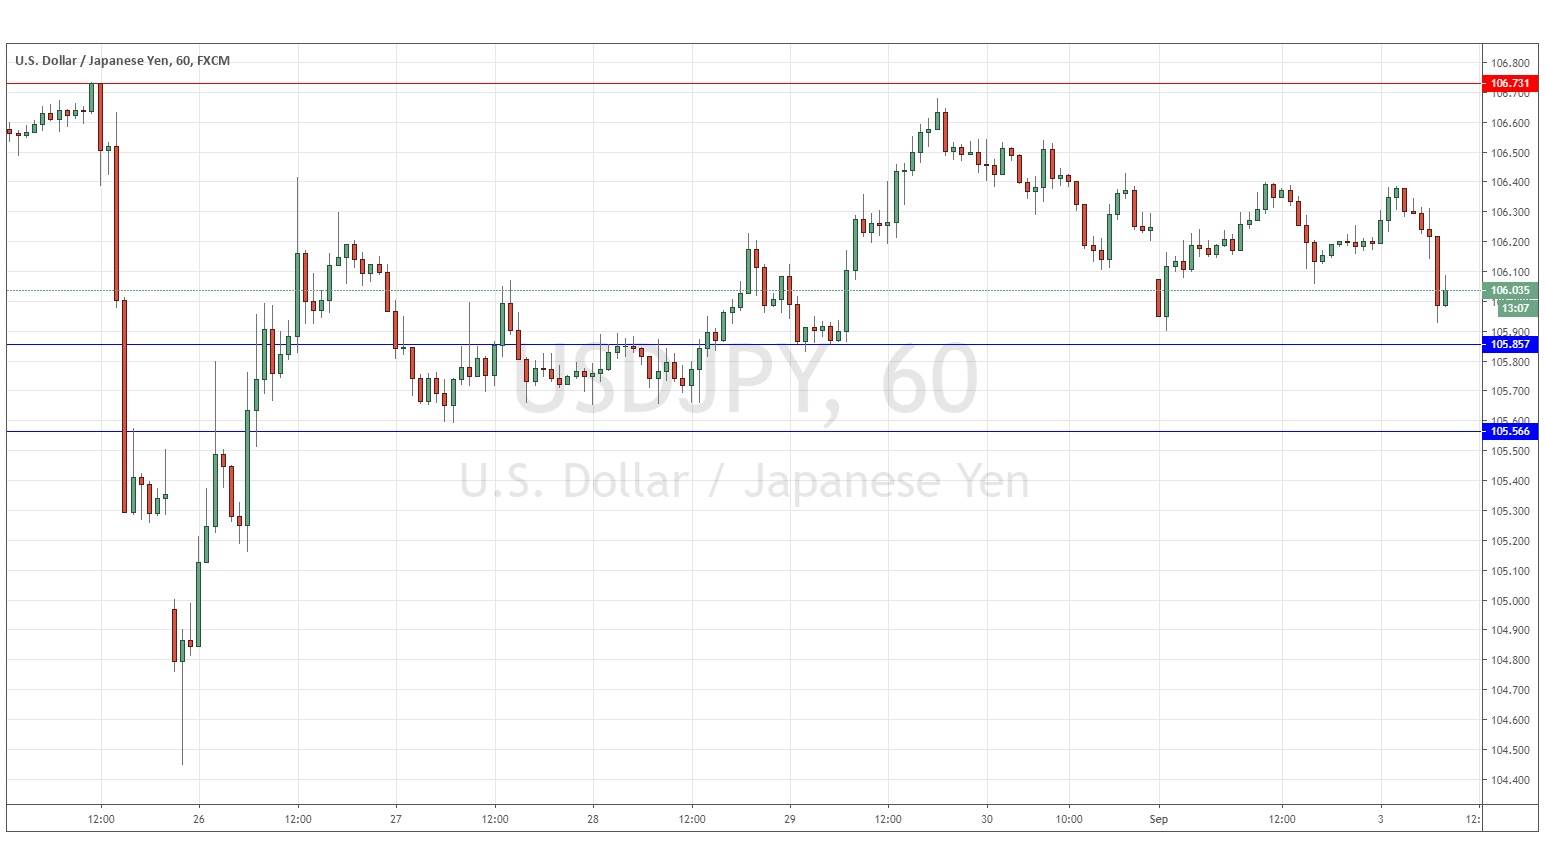
USDJPY: Consolidation between 105.86 and 106.73
Yesterday’s signals produced a profitable long trade from the bullish inside candlestick break on the hourly chart which rejected the support level identified at 106.09. However, this gave only a little more than the minimum profit of 20 pips.
Today’s USD/JPY Signals
Risk 0.75%.
Trades may only be entered before 5pm Tokyo time Wednesday.
Short Trade Ideas
Go short following a bearish price action reversal on the H1 time frame immediately upon the next touch of 106.73, 107.21 or 107.26.
Put the stop loss 1 pip above the local swing high.
Move the stop loss to break even once the trade is 20 pips in profit.
Remove 50% of the position as profit when the trade is 20 pips in profit and leave the remainder of the position to ride.
Long Trade Ideas
Go long following a bullish price action reversal on the H1 time frame immediately upon the next touch of 105.86 or 105.57.
Put the stop loss 1 pip below the local swing low.
Move the stop loss to break even once the trade is 20 pips in profit.
Remove 50% of the position as profit when the trade is 20 pips in profit and leave the remainder of the position to ride.
The best method to identify a classic “price action reversal” is for an hourly candle to close, such as a pin bar, a doji, an outside or even just an engulfing candle with a higher close. You can exploit these levels or zones by watching the price action that occurs at the given levels.
USD/JPY Analysis
I wrote yesterday that the picture here was looking confused and I felt unable to make any call beyond predicting that the resistance at 106.73 was likely to hold, as was the support at 105.57, so reversals at either extreme should be the best approach.
This was a good call insofar as it was at least enough to stay out of trouble.
The price yesterday bounced from the support level I had identified at 106.07, but the level was subsequently invalidated.
The technical picture is now even more as I described it yesterday: a consolidation between 105.86 and 106.73 with both levels looking strong and likely to hold.
Another technical feature worth noting is the double top at 109.40 which may also now act as resistance if it is retested.
I would again look to fade any of the three key levels shown in the price chart below if there is a solid reversal at a test of any of them. There is nothing of high importance due today concerning the JPY. Regarding the USD, there will be a release of ISM Manufacturing PMI data at 3pm London time.
