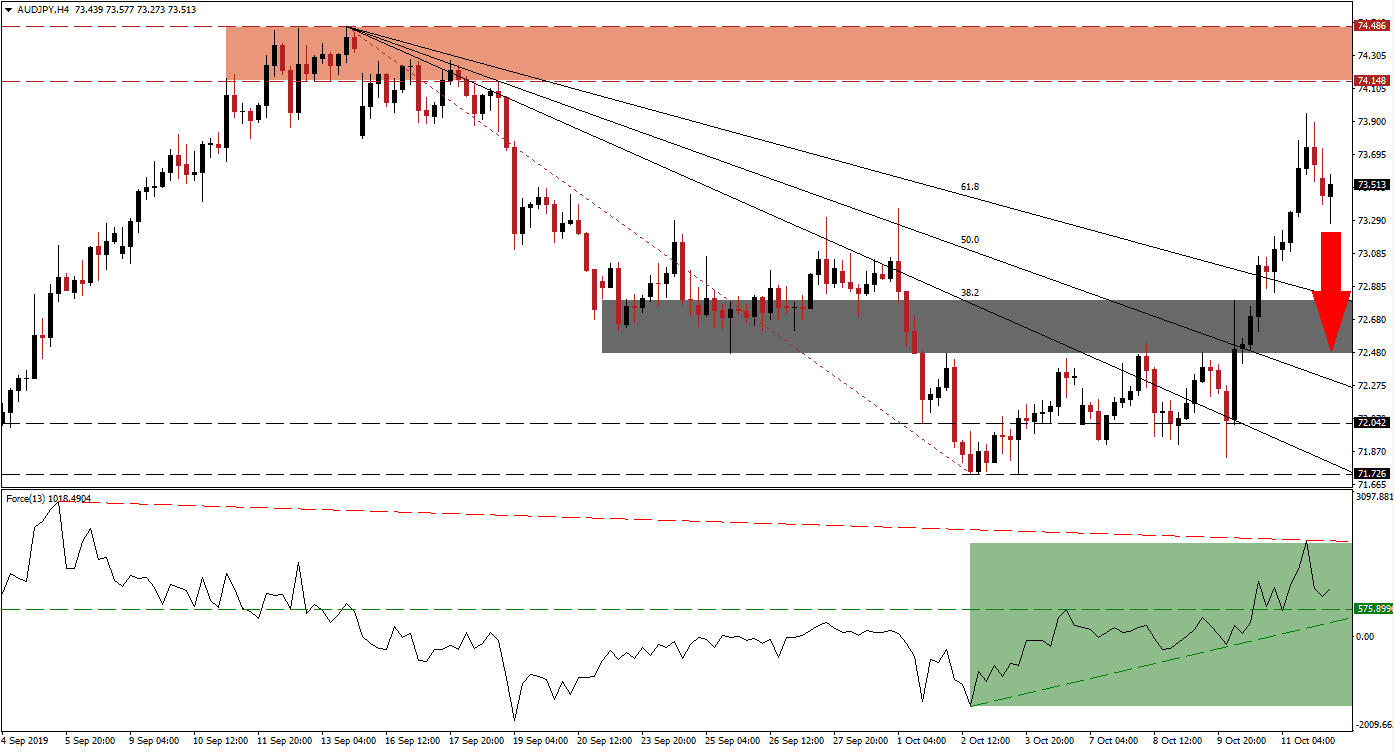
After the US and China announced that the details of a partial trade deal will be worked out and new tariffs delayed, risk-on sentiment overtook the markets and traders fled safe-haven assets. This morning’s Chinese economic data has provided a reminder that the global economy continues to slow down which was enough to halt the advance in the AUD/JPY after a series of breakouts took this currency pair close to its resistance zone. A partial reversal back down into its descending 61.8 Fibonacci Retracement Fan Support Level may follow, this would keep the overall uptrend intact.
The Force Index, a next generation technical indicator, supported the breakout sequence in the AUD/JPY as its own ascending support level pushed it above its horizontal resistance level and turned it into support. After the breakout in price action above its 61.8 Fibonacci Retracement Fan Resistance Level, bullish momentum started to recede and the Force Index retreated from a lower high which allowed a descending resistance level to be formed. This technical indicator remains well in positive territory, as marked by the green rectangle, which means that bulls are still in control of this currency pair. You can learn more about the Fibonacci Retracement Fan, the Force Index and the Support Zone here.
Volatility has increased as price action appears to have exhausted its advance while closing in on its resistance zone. The current intra-day high of 73.948 is located just below its resistance zone between 74.148 and 74.486 which is marked by the red rectangle. Forex traders should now monitor the intra-day low of 73.273 which represents the low of the current pause in the breakout sequence of the AUD/JPY. A sustained moved below this level is likely to attract fresh sell-order into this currency pair. More details about the partial trade deal could also provide the next fundamental catalyst.
A price action reversal back into its 61.8 Fibonacci Retracement Fan Support Level may follow which would represent a healthy pull-back without violating the general uptrend. In addition, the 61.8 Fibonacci Retracement Fan Support Level has now reached the top range of its next short-term support zone which is located between 72.471 and 72.800 as marked by the grey rectangle. As long as the Force Index can remain above its ascending support level and in positive conditions, the long-term up-trend remains dominant. You can learn more about a Breakout, a Breakdown and the Resistance Zone here.
AUD/JPY Technical Trading Set-Up - Price Action Reversal Scenario
- Short Entry @ 73.550
- Take Profit @ 72.600
- Stop Loss @ 73.850
- Downside Potential: 95 pips
- Upside Risk: 30 pips
- Risk/Reward Ratio: 3.17
Should the Force Index complete a breakout above its descending resistance level, the AUD/JPY is expected to extend its rally which may be limited to its resistance zone. While the mood has improved with the announcement of a partial US-China trade deal and a Brexit deal has become more likely, the global fundamental picture continues to point towards a rise in issues. Third-quarter earnings season may inspire another risk-off period, if expectations of a severe slowdown with a weak outlook are met.
AUD/JPY Technical Trading Set-Up - Limited Breakout Extension Scenario
- Long Entry @ 74.000
- Take Profit @ 74.450
- Stop Loss @ 73.800
- Upside Potential: 45 pips
- Downside Risk: 20 pips
- Risk/Reward Ratio: 2.25
