BTC/USD: Is a price action reversal imminent?
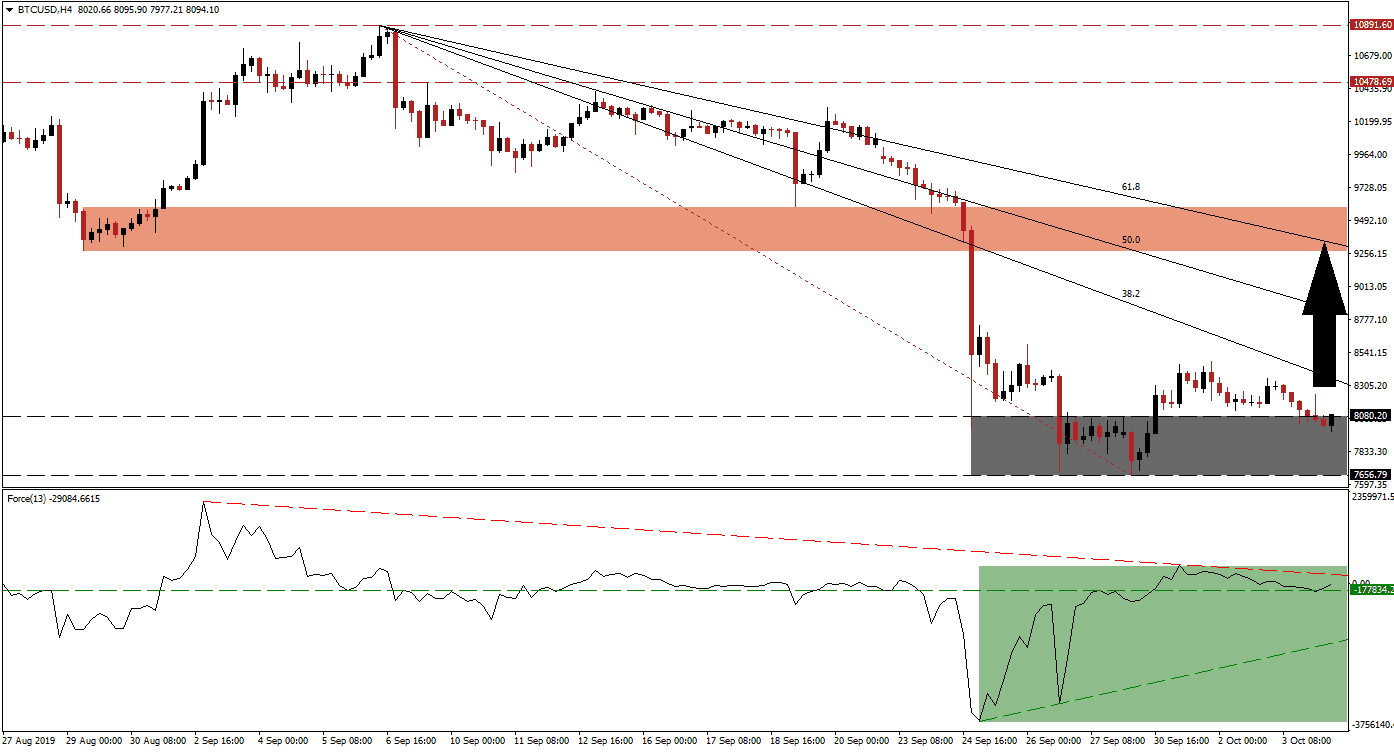
Following the sharp sell-off in BTC/USD after its hashrate flash crash, a sideways trend emerged which is slowly depleting bearish momentum. This has allowed the descending 38.2 Fibonacci Retracement Fan Resistance Level to close in on its support zone. Volatility is expected to increase as this cryptocurrency pair is expected to attempt a breakout, the slow build-up in bullish sentiment should help price action to enter into a short-term counter-trend move.
The Force Index, a next generation technical indicator, confirms the loss in bearish momentum with a sharp recover of its own which took it above its horizontal resistance level and turning it into support. Its descending resistance level is approaching and the Force Index remains in negative territory as marked by the green rectangle in the chart. An ascending support level is expected to limit the downside which further supports a short-term reversal in BTC/USD. A breakout above its descending resistance level will place the Force Index into positive territory. You can learn more about the Fibonacci Retracement Fan, the Force Index and the Support Zone here.
Price action initially completed a breakout above its support zone which is located between 7,656.79 and 8,080.20 as marked by the grey rectangle. After the breakout recorded an intra-day high of 8,480.40, it reversed back into its support zone. Should BTC/USD manage to sustain a new breakout above its support zone, momentum should take it above its 38.2 Fibonacci Retracement Fan Resistance Level and turn it into support. This would also result in the formation of a higher low as the current intra-day low of the breakout reversal is 7,977.21; this is another bullish development if a reversal materializes.
Forex traders should now follow the Force Index in order to see if the current reversal can result in a breakout above its descending resistance level together with a move in BTC/USD above its intra-day high of 8,480.40 will also place price action above its 38.2 Fibonacci Retracement Fan Resistance Level. This will clear the path for the breakout to extend into its next resistance zone which is located between 9,275.57 and 9,592.19 as marked by the red rectangle; the 61.8 Fibonacci Retracement Fan Resistance Level is currently passing through it. An advance into this level will keep the down-trend intact. You can learn more about a Breakout, a Breakdown and the Resistance Zone here.
BTC/USD Technical Trading Set-Up - Breakout Scenario
Long Entry @ 8,250.00
Take Profit @ 9,425.00
Stop Loss @ 7,800.00
Upside Potential: 117,500 pips
Downside Risk: 45,000 pips
Risk/Reward Ratio: 2.61
Should the 38.2 Fibonacci Retracement Fan Resistance Level pressure BTC/USD to the downside, a breakdown below its support zone will extend the sell-off. The next support zone is located between 6,380.84 and 6,818.05 which would also close two price gaps which formed during the previous advance. This would represent an excellent long-term buying opportunity in this cryptocurrency pair.
BTC/USD Technical Trading Set-Up - Breakdown Scenario
Short Entry @ 7,460.00
Take Profit @ 7,825.00
Stop Loss @ 6,560.00
Downside Potential: 90,000 pips
Upside Risk: 36,500 pips
Risk/Reward Ratio: 2.47

