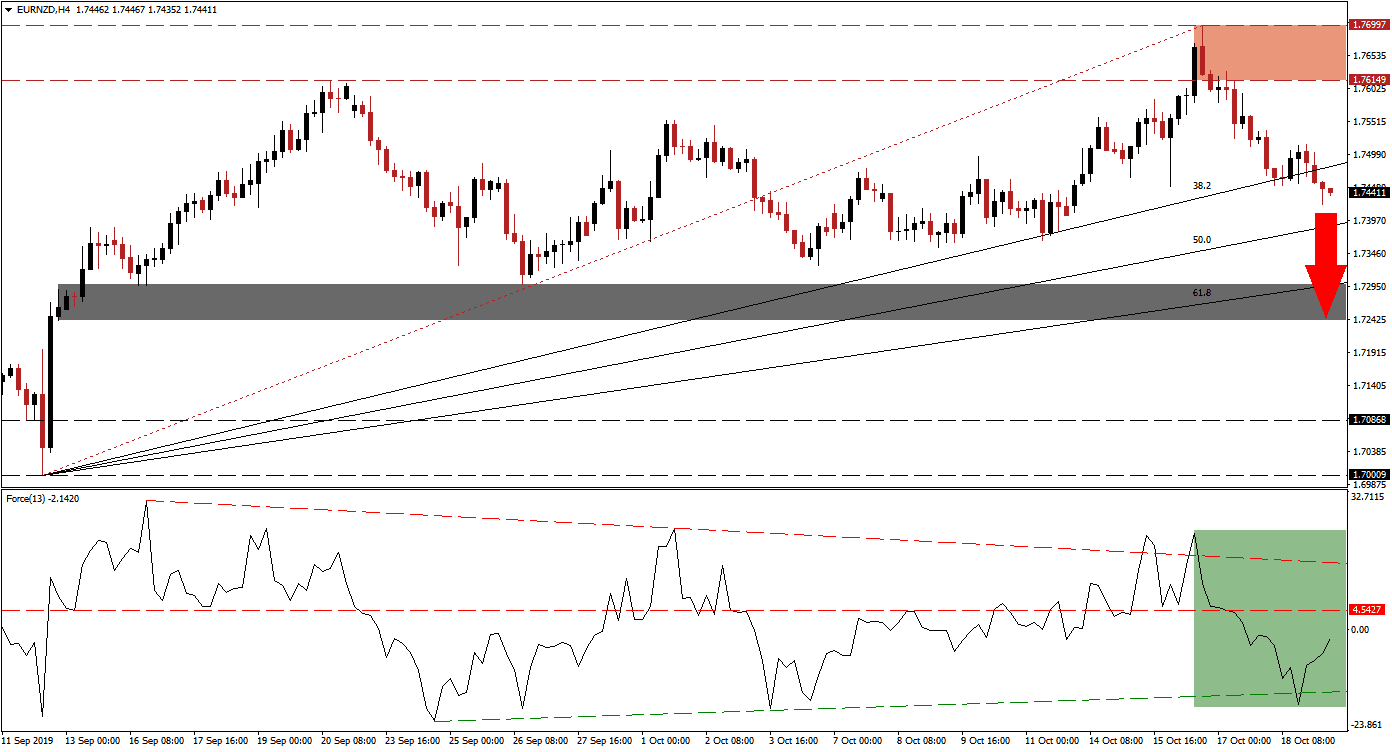
After China kept its 1-Year and 5-Year Prime Loan Rate unchanged, against a backdrop of expectations which called for a 5 basis point and 2 basis point cut respectively, the New Zealand Dollar extended its advance. Brexit uncertainty following the delay of the vote this past Saturday started to pressure the Euro to the downside and the combination of both factors initiated a breakdown sequence in the EUR/NZD. Following a breakdown below its resistance zone, price action now completed a breakdown below its ascending 38.2 Fibonacci Retracement Fan Support Level, turning it into resistance; the breakdown sequence is expected to continue.
The Force Index, a next generation technical indicator, plunged from above its descending resistance level to below its ascending support level as the EUR/NZD completed the two breakouts. Bearish momentum started to deplete and the Force Index bounced to the upside as marked by the green rectangle in the chart. This technical indicator remains below its horizontal resistance level and its descending resistance level is closing in; additionally it remains in negative territory which suggests that bears remain in control of this currency pair. As long as this technical indicator will remain below its horizontal resistance level, the downtrend remains intact. You can learn more about the Fibonacci Retracement Fan, the Force Index and the Support Zone here.
Following the breakdown below its resistance zone, located between 1.76149 and 1.76997 which is marked by the red rectangle, the longer term uptrend has been violated with the subsequent breakdown below its 38.2 Fibonacci Retracement Fan Support Level. Forex traders should now monitor the intra-day low of 1.74226, which marks the current low of the breakdown sequence in the EUR/NZD, as a move below it is expected to increase selling pressure on this currency pair. Another key level to watch out for is the intra-day low of 1.73661 as a push below this mark would start a new long-term downtrend in price action.

Economic disappointments out of the Eurozone are likely to continue which will provide a fundamental catalyst to the downside for the EUR/NZD. The next short-term support zone is located between 1.72423 and 1.72983 which is marked by the grey rectangle; the 61.8 Fibonacci Retracement Fan Support Level has just eclipsed the top range of this zone. Encouraging economic data out of China for the month of September have provided a boost to the New Zealand Dollar, as the New Zealand economy is heavily dependent on the Chinese economy. A further breakdown below its short-term support zone cannot be ruled out with the next long-term support zone located between 1.70009 and 1.70868; a new fundamental catalysts may be required for such a move. You can learn more about a Breakout, a Breakdown and the Resistance Zone here.
EUR/NZD Technical Trading Set-Up - Breakdown Extension Scenario
- Short Entry @ 1.74450
- Take Profit @ 1.72450
- Stop Loss @ 1.75150
- Downside Potential: 200 pips
- Upside Risk: 70 pips
- Risk/Reward Ratio: 2.86
Should the Force Index possess enough momentum to extend its bounce and push above its horizontal resistance level, turning it back into support, the EUR/NZD may attempt a breakout above its 38.2 Fibonacci Retracement Fan Resistance Level. Upside potential is expected to be capped by its resistance zone which should be considered a solid short-entry opportunity as the long-term outlook remains bearish for this currency pair.
EUR/NZD Technical Trading Set-Up - Limited Breakout Scenario
- Long Entry @ 1.75250
- Take Profit @ 1.76300
- Stop Loss @ 1.74800
- Upside Potential: 105 pips
- Downside Risk: 45 pips
- Risk/Reward Ratio: 2.33
