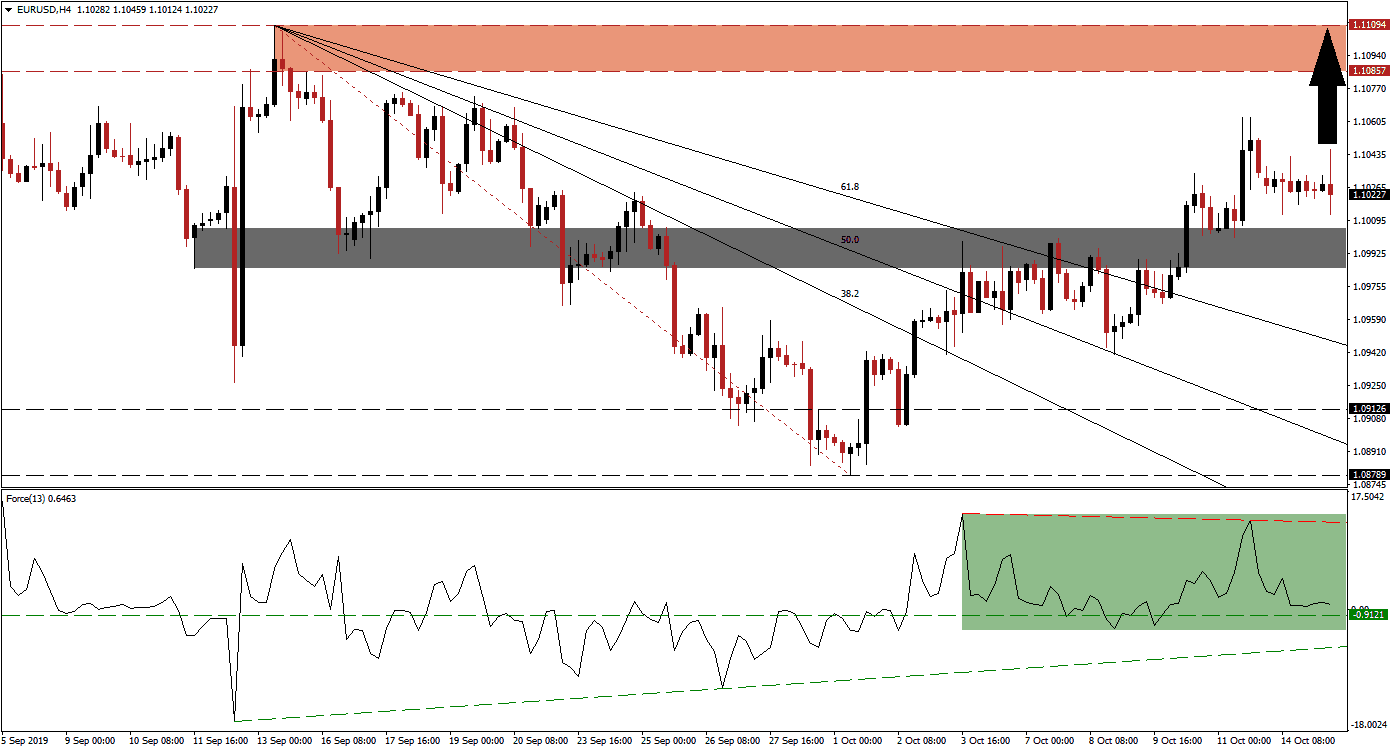
As series of breakouts, despite ongoing economic weakness in the Eurozone and fresh tariffs on the EU due to the latest WTO ruling, has elevated the EUR/USD off of extreme oversold conditions. After pushing above its long-term support zone, price action accelerated through its entire Fibonacci Retracement Fan sequence and turned it from resistance into support. Bullish momentum further carried this currency pair to the upside and allowed it to complete a breakout above its short-term resistance zone, turning it into support. Weakening economic conditions out of the US together with its central bank which is expected to cut interest rates again this month have assisted the breakout sequence.
The Force Index, a next generation technical indicator, has confirmed the overall increase in bullish momentum as the EUR/USD took out several resistance levels. The Force Index was able to use its ascending support level and complete a breakout above its horizontal resistance level, turning it into support. While a shallow negative divergence formed, a bearish trading signal, price action may spike into its next resistance zone before facing a corrective phase. This technical indicator remains in positive conditions as marked by the green rectangle, suggesting bulls remain in control, and as long as it will remain above its ascending support level more short-term upside is possible. You can learn more about the Fibonacci Retracement Fan, the Force Index and the Support Zone here.
Volatility is expected to remain elevated and today’s ZEW data out of the Eurozone could provide a short-term catalyst while markets await more details about the partial US-China trade deal which has failed to address any of the key issues; sentiment towards it is already deteriorating. The short-term support zone, located between 1.09849 and 1.00054 which is marked by the grey rectangle, is expected to hold given the current fundamental as well as technical picture. Markets have already priced in a weak ZEW survey which will show conditions for October have weakened which could result in an upside surprise.
With a solid short-term support zone, the EUR/USD is set to expand its breakout into its next resistance zone which is located between 1.10857 and 1.11094 as marked by the red rectangle. Forex traders should monitor the intra-day high of 1.10335 which marks the high following the breakout above its short-term resistance zone which turned it into support. A reversal into its new support zone resulted in a renewed push high from where price action changed direction once again, creating a higher low. Should the EUR/USD sustain a move above the 1.10335 mark, fresh buy orders are likely to follow. You can learn more about a Breakout, a Breakdown and the Resistance Zone here.
EUR/USD Technical Trading Set-Up - Breakout Extension Scenario
Long Entry @ 1.10200
Take Profit @ 1.11050
Stop Loss @ 1.09950
Upside Potential: 85 pips
Downside Risk: 25 pips
Risk/Reward Ratio: 3.40
Should the Force Index complete a breakdown below its ascending support level, turning it into resistance, the EUR/USD may follow suit with a breakdown below its short-term support zone and turn it back into resistance. This may lead price action back into its next long-term support zone which is located between 1.08789 and 1.09126 which should be considered a good long-term buying opportunity as the fundamental picture favors a stronger EUR/USD moving forward.
EUR/USD Technical Trading Set-Up - Breakdown Scenario
Short Entry @ 1.09800
Take Profit @ 1.09050
Stop Loss @ 1.10100
Downside Potential: 75 pips
Upside Risk: 30 pips
Risk/Reward Ratio: 2.50


