GBP/AUD: Breakdown risks are on the rise
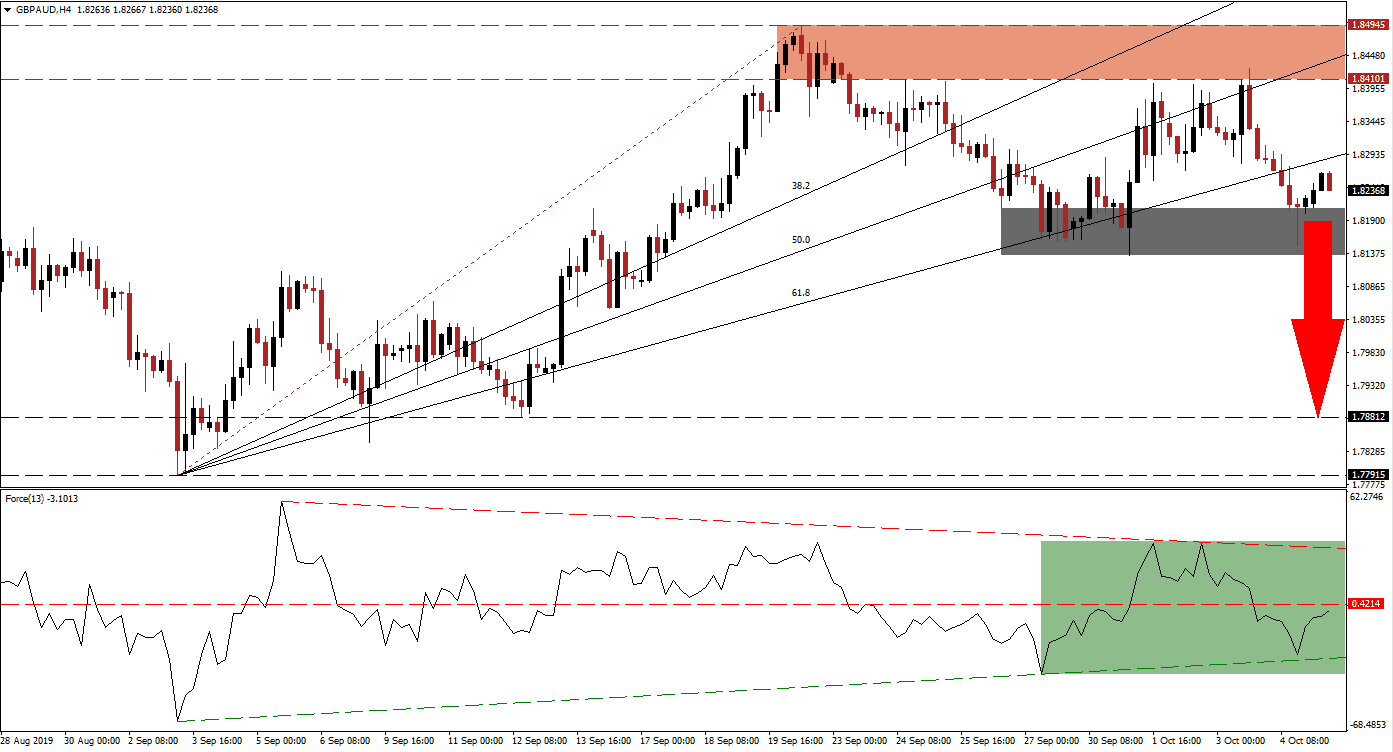
While the Brexit deadline is October 31st 2019, UK Parliament passed what Prime Minister Boris Johnson has labeled the “surrender act” which makes next week’s EU summit, held between October 17th and October 18th, the next key data to monitor. Expectations for a deal by that time are very thin and the British Pound could be exposed to a renewed push to the downside. Price action in the GBP/AUD completed a breakdown through its Fibonacci Retracement Fan sequence and turned it from support in resistance, but was able to halt the sell-off after reaching its short-term support zone.
The Force Index, a next generation technical indicator, contracted together with price action after its resistance zone rejected a further advance. This has created a lower high in price action and the GBP/AUD accelerated to the downside. After closing in on its ascending support level, the Force Index recovered to the upside but remains in negative conditions below its horizontal resistance level. This is marked by the green rectangle and as this currency pair is experiencing a rise in bearish momentum from its ascending 61.8 Fibonacci Retracement Fan Resistance Level, breakdown risks are on the rise. You can learn more about the Fibonacci Retracement Fan, the Force Index and the Support Zone here.
Following the lower high in the GBP/AUD at the bottom range of its resistance zone, long-term bearish momentum has increased. The resistance zone is located between 1.84101 and 1.84945 which is marked by the red rectangle. The 50.0 Fibonacci Retracement Fan Resistance Level is currently located inside this zone with the 38.2 Fibonacci Retracement Fan Resistance Level above it. This week’s US-China trade talks to represent a short-term risk to the Australian Dollar, but this is trumped by Brexit uncertainty in the British Pound. Over the weekend talks between the US and North Korea broke down which could be duplicated between the US and China.
A confirmed breakdown below its short-term support zone, which is located between 1.81357 and 1.82090 as marked by the grey rectangle, will clear the path to the downside for this currency pair. The next long-term support zone is located between 1.77195 and 1.78812, from where the current Fibonacci Retracement Fan sequence originated. As long as the Force Index will remain below its descending resistance level, the bearish scenario is dominant; this is further supported by the current fundamental picture which calls for a weaker GBP/AUD moving forward. You can learn more about a Breakout, a Breakdown and the Resistance Zone here.
GBP/AUD Technical Trading Set-Up - Breakdown Scenario
Short Entry @ 1.82500
Take Profit @ 1.78800
Stop Loss @ 1.83300
Downside Potential: 370 pips
Upside Risk: 80 pips
Risk/Reward Ratio: 4.63
In case the Force Index can maintain an advance above its horizontal resistance level, turning it into support, as the GBP/AUD completes a breakout above its 61.8 Fibonacci Retracement Fan Resistance Level, a short-term push into its resistance zone is possible. Any such advance should be considered a strong selling opportunity in this currency pair, especially if the Force Index remains below its descending resistance level.
GBP/AUD Technical Trading Set-Up - Limited Breakout Scenario
Long Entry @ 1.83500
Take Profit @ 1.84500
Stop Loss @ 1.83000
Upside Potential: 100 pips
Downside Risk: 50 pips
Risk/Reward Ratio: 2.00

