GBP/USD: Is a price action reversal brewing?
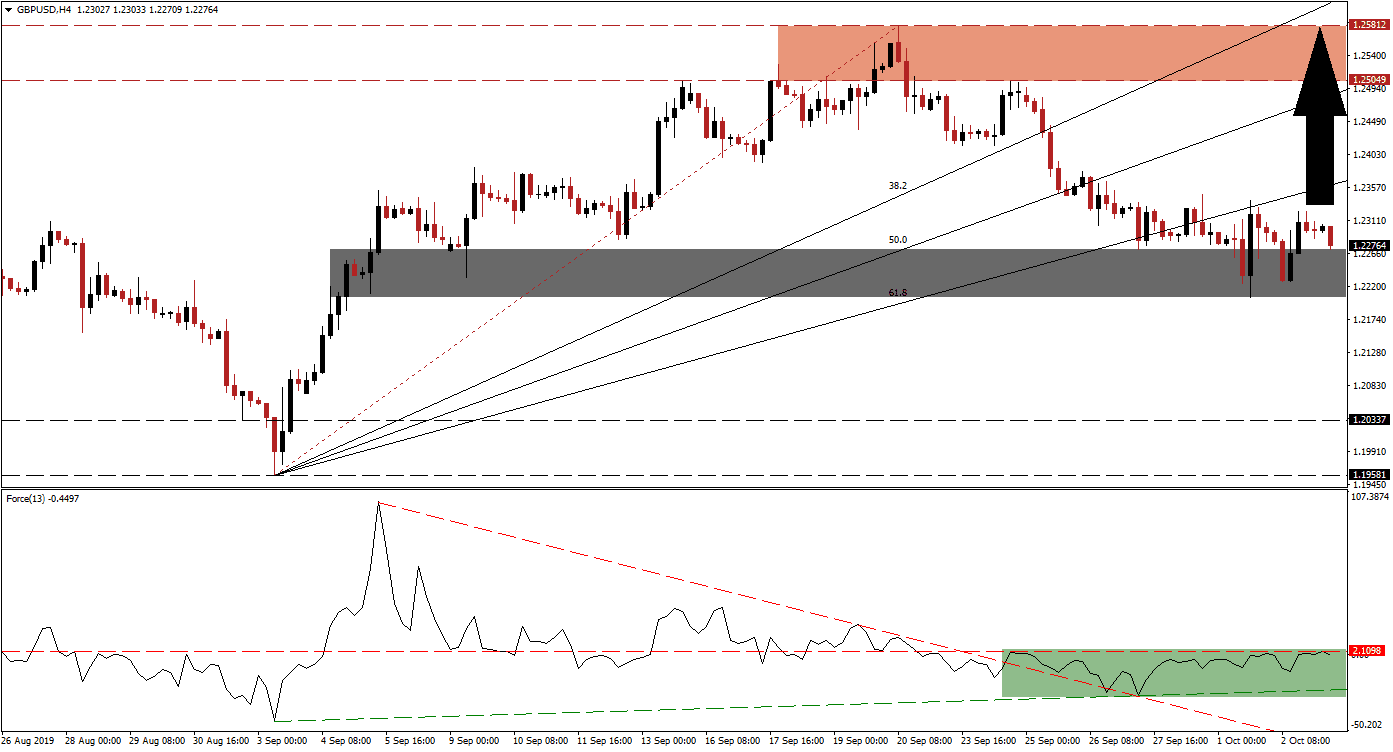
British Prime Minister Boris Johnson has a new Brexit plan, but it received a cool response from the EU so far as it awaits how UK Parliament will react to it. This resulted in weakness in the British Pound and the GBP/USD entered a sideways trend after descending from its resistance zone through its entire Fibonacci Retracement Fan sequence, turning it from support into resistance. Price action is now trading below its ascending 61.8 Fibonacci Retracement Fan Resistance Level, but above its short-term support zone which halted the sell-off.
The Force Index, a next generation technical indicator, entered a sideways trend of its own with a bullish bias which has been confined to a narrow range. After the Force Index moved above a long descending resistance level which crossed a shallow ascending support level, it started to advance. This technical indicator is now trading just below its horizontal resistance level as marked by the green rectangle. The bullish bias is expected to suffice for a breakout above it which should lead the GBP/USD to the upside. You can learn more about the Fibonacci Retracement Fan, the Force Index and the Support Zone here.
Volatility is expected to remain high and forex traders will get UK Services and Composite PMI data for September later in the session. While expectations call for the slowdown to extend, this data series is known to surprise to the upside and could provide a short-term fundamental boost to the GBP/USD. The short-term support zone which is located between 1.22048 and 1.22708 as marked by the grey rectangle is expected to hold even if the data comes in lower than anticipated. As long as the Force Index will remain above its ascending support level, the bullish bias should dominate.
Adding to long-term bullish momentum in the GBP/USD is disappointing manufacturing data which adds to today’s ISM Non-Manufacturing Index relevance, a slowdown in the service sector is expected to drop the US Dollar. A breakout in price action above its 61.8 Fibonacci Retracement Fan Resistance Level, if confirmed by a breakout in the Force Index, will clear the path for an extension into its next resistance zone. This zone is located between 1.25049 and 1.25812 as marked by the red rectangle. The 50.0 Fibonacci Retracement Fan Resistance Level is located just below this zone while the 38.2 Fibonacci Retracement Fan Resistance Level is positioned above it. You can learn more about a Breakout, a Breakdown and the Resistance Zone here.
GBP/USD Technical Trading Set-Up - Breakout Scenario
Long Entry @ 1.22700
Take Profit @ 1.25700
Stop Loss @ 1.21800
Upside Potential: 300 pips
Downside Risk: 90 pips
Risk/Reward Ratio: 3.33
A negative reception by Parliament towards PM Johnson’s new Brexit deal is expected to result in a new wave of sell-orders in the GBP/USD which could lead to a breakdown below its short-term support zone. This would bring its next support zone, located between 1.19581 and 1.20337, into play. Any move into this zone should be viewed as an excellent long-term buying opportunity.
GBP/USD Technical Trading Set-Up - Breakdown Scenario
Short Entry @ 1.21650
Take Profit @ 1.19650
Stop Loss @ 1.22050
Downside Potential: 100 pips
Upside Risk: 40 pips
Risk/Reward Ratio: 2.50

