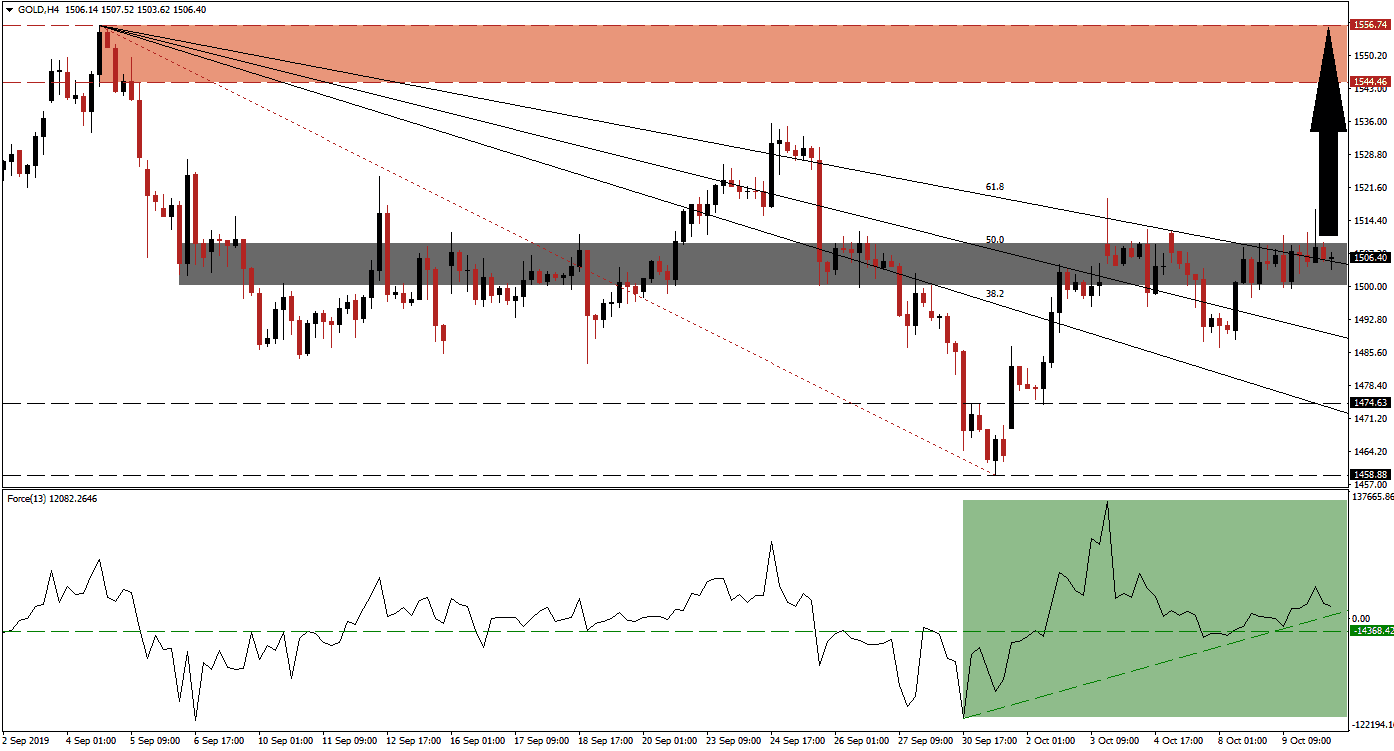
Gold is turning its short-term resistance zone back into support following a reversal from a previous breakdown. Bullish momentum is on the rise as fundamental factors have boosted demand for this safe haven asset. The 61.8 Fibonacci Retracement Fan Resistance Level is passing thorough the support zone and price action is trading above-and-below this level with a clear bullish bias. A confirmed push higher will allow this precious metal to eclipse its short-term support zone and accelerate to the upside until it can challenge its next long-term resistance zone.
The Force Index, a next generation technical indicator, is pointing towards the build-up in bullish momentum which is expected to pressure price action into a breakout. The reversal of the breakdown below the short-term support zone in gold has allowed the Force Index to move above its horizontal resistance level, turning it into support. Its ascending support level is additionally assisting the advance in this technical indicator which is trading in positive conditions; this is marked by the green rectangle. Developments out of today’s high level US-China trade talks are expected to impact price action in gold. You can learn more about the Fibonacci Retracement Fan, the Force Index and the Support Zone here.
With the rise in bullish momentum as gold is trending sideways inside of its short-term support zone, located between 1,500.27 and 1,509.48 as marked by the grey rectangle, a breakout is expected to follow. Forex traders should monitor the intra-day high of 1,519.20 which represents the high of the previous rally when price action surged from its long-term support zone through its entire Fibonacci Retracement Fan sequence, before changing direction which took gold below its short-term support zone which has now been reversed. A move above this level is expected to increase bullish momentum further and push price action to the upside.
As gold is priced in US Dollars, the pair has enjoyed an inverse relationship; when the US Dollar weakened, gold advanced. The current global fundamental environment has allowed price action to advance while the US Dollar remained relatively strong. Once the US Dollar strength is eroding, this precious metal will receive an additional bullish boost. The 1,500 psychological mark has proven a solid support level while the next long-term resistance zone is located between 1,544.46 and 1,556.74 as marked by the red rectangle. More upside is possible, but a new fundamental catalyst would be required. You can learn more about a Breakout, a Breakdown and the Resistance Zone here.
Gold Technical Trading Set-Up - Breakout Scenario
Long Entry @ 1,506.50
Take Profit @ 1,556.50
Stop Loss @ 1.492.00
Upside Potential: 5,000 pips
Downside Risk: 1,450 pips
Risk/Reward Ratio: 3.45
While another breakdown in gold cannot be ruled out, the fundamental picture favors an increase in price action. A confirmed breakdown in gold, by a breakdown in the Force Index below its ascending support level, can take price action into its next long-term support zone which is located between 1,458.88 and 1,474.63. The descending 38.2 Fibonacci Retracement Fan Support Level is currently passing through this zone and any potential pull-back should be viewed as a solid long-term buying opportunity in gold.
Gold Technical Trading Set-Up - Limited Breakdown Scenario
Short Entry @ 1,485.00
Take Profit @ 1,470.00
Stop Loss @ 1,492.00
Downside Potential: 1,500 pips
Upside Risk: 700 pips
Risk/Reward Ratio: 2.14

