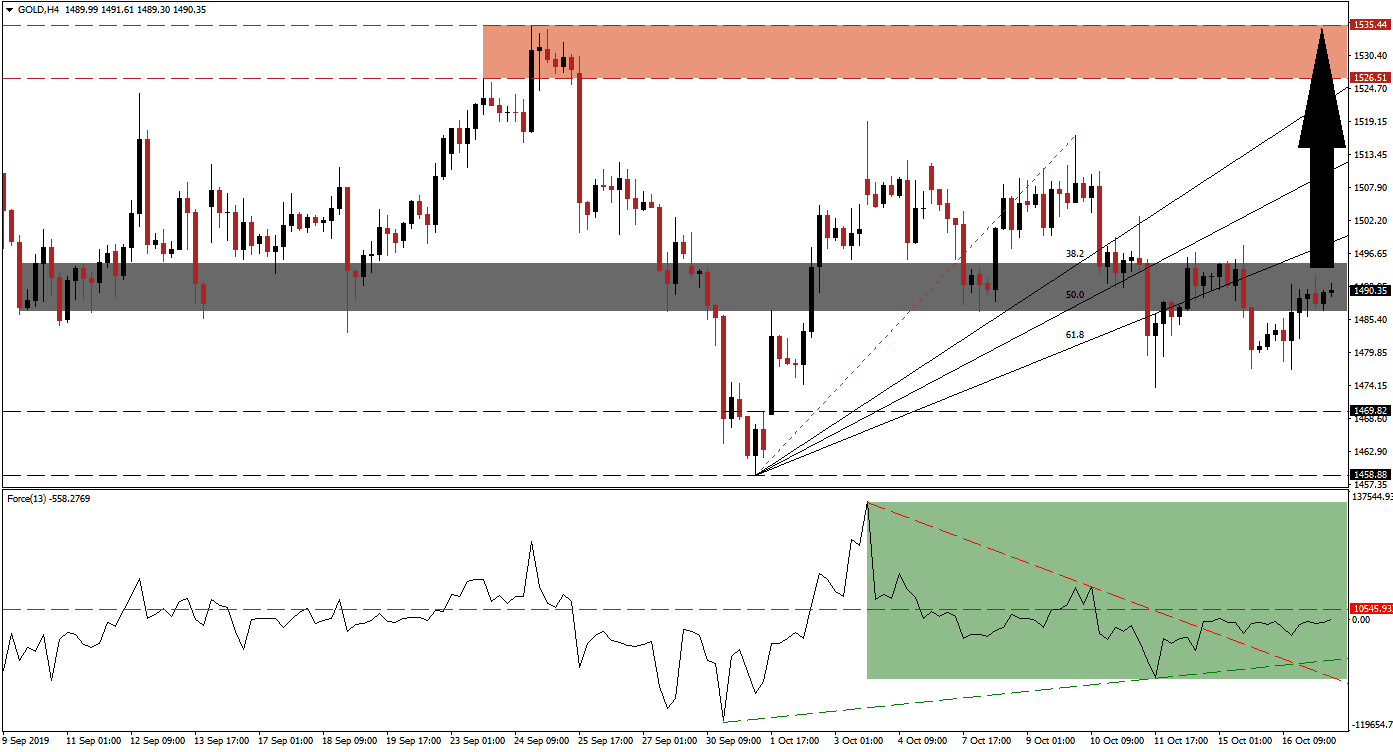
A period of risk-on mentality gave traders an excuse to realize floating trading profits in gold, but this period has now ended after price action recovered from a breakdown below its short-term support zone and moved back inside it. Lack of details over the temporary trade truce between the US and China have pushed price action higher and the volatile moves did create a higher low which represents a bullish development. The confirmed short-term support zone is located just beneath a re-drawn Fibonacci Retracement Fan sequence which was turned into an ascending resistance level following the complete breakdown below it.
The Force Index, a next generation technical indicator, confirms the overall bullish bias following a breakdown of its own below its horizontal support level which was turned into resistance. After gold dropped below its 61.8 Fibonacci Retracement Fan Support Level, turning it into resistance, the Force Index recorded a higher low and an ascending support level emerged. The sideways trend with a bullish tendency resulted in the breakout above its descending resistance level; but this technical indicator remains in negative conditions as marked by the green rectangle and bears are still in charge of gold. You can learn more about the Fibonacci Retracement Fan, the Force Index and the Support Zone here.
A breakout in the Force Index above its horizontal resistance level, which will turn it into support, is likely to lead price action into a breakout above its short-term support zone. This zone is located between 1,486.73 and 1,494.89 which is marked by the grey rectangle in the chart. Given the close proximity of the top range of the support zone to the 61.8 Fibonacci Retracement Fan Resistance Level, a breakout is likely to carry it above this level as well and turn it back into support. The intra-day high of 1,498.04 should be monitored as a move higher is expected to result in the addition of new net buy orders; this level marks the peak of the advance which led to the breakdown below its support zone and resulted in a higher low.
With the increase in uncertain outcomes as well as fresh evidence that the global economy is moving closer to a recession, gold is expected to advance on the back of safe haven demand as well as central bank buying. The re-drawn Fibonacci Retracement Fan sequence is expected to lead price action into its resistance zone which is located between 1,526.51 and 1,535.44 as marked by the red rectangle; the ascending 38.2 Fibonacci Retracement Fan Resistance Level is currently located just below the bottom range of this zone. Volatility is expected to remain high, but the fundamental picture favors a new push higher in gold which is support by the current technical scenario. You can learn more about a Breakout, a Breakdown and the Resistance Zone here.
Gold Technical Trading Set-Up - Breakout Scenario
Long Entry @ 1,490.00
Take Profit @ 1,530.00
Stop Loss @ 1,478.00
Upside Potential: 4,000 pips
Downside Risk: 1,200 pips
Risk/Reward Ratio: 3.33
In the event that positive news flow emerges which will alleviate the current fears, gold could reverse back below its short-term support zone and turn it back into resistance. The next long-term support zone is located between 1,458.88 and 1,469.82, where the current Fibonacci Retracement Fan sequence originates. Any sell-off into this zone should be viewed as an excellent long-term buying opportunity in gold.
Gold Technical Trading Set-Up - Limited Breakdown Scenario
Short Entry @ 1,475.00
Take Profit @ 1,462.50
Stop Loss @ 1,480.00
Downside Potential: 1,250 pips
Upside Risk: 500 pips
Risk/Reward Ratio: 2.50

