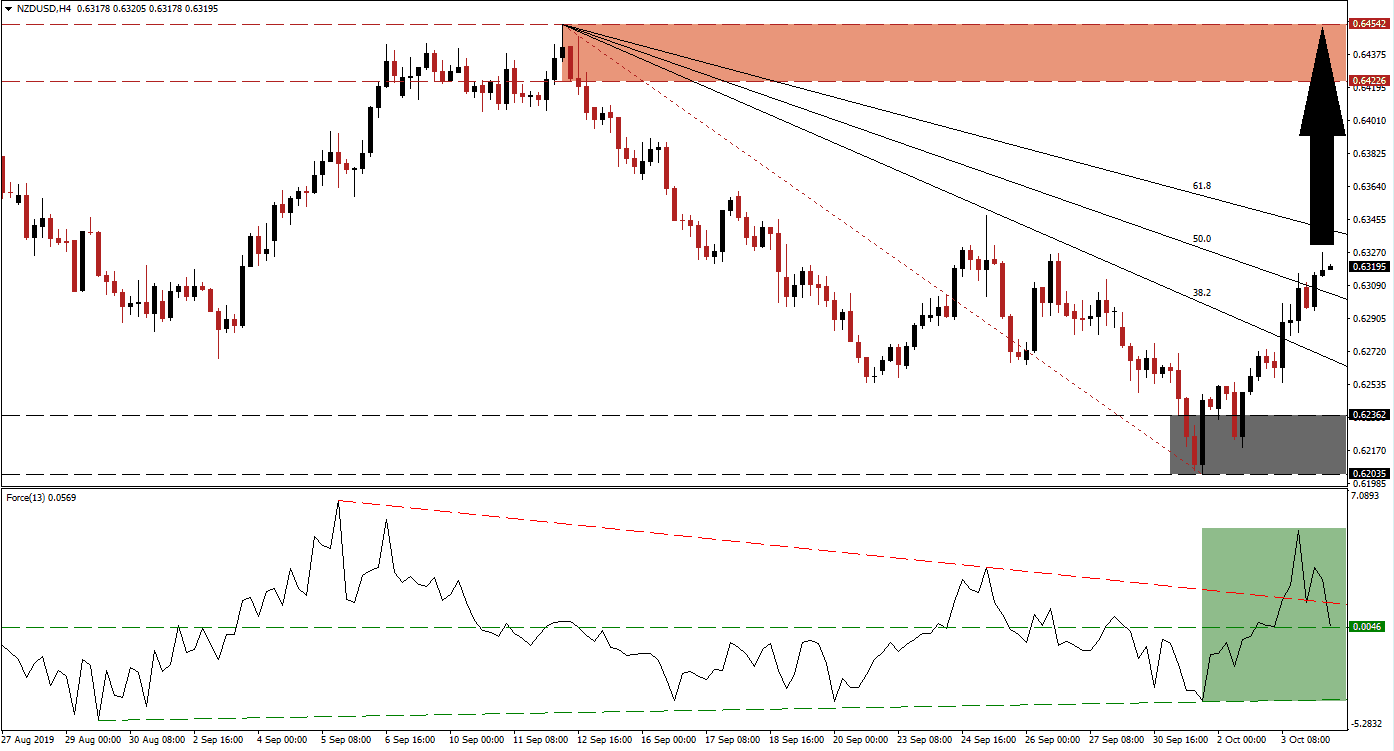
A series of much-worse-than expected economic data out of the US in regards to its manufacturing as well as services sector have allowed the NZD/USD to recover from depressed levels. After the ISM Manufacturing Index printed the worst figures in a decade, price action quickly completed a breakout above its support zone and the rise in bullish momentum extended this move, elevating the NZD/USD above its 38.2 Fibonacci Retracement Fan Resistance Level as well as its 50.0 Fibonacci Retracement Fan Resistance Level.
The Force Index, a next generation technical indicator, confirmed the breakouts as it accelerated to the upside from a shallow ascending support level resulted in a sharp spike higher. Bullish momentum was strong enough to result in a breakout above its horizontal resistance level and above its descending resistance level, turning both into support. This is marked by the green rectangle and the Force Index is now trading in positive territory above support, but started to retreat slightly from its most recent peak as the NZD/USD is taking a pause. You can learn more about the Fibonacci Retracement Fan, the Force Index and the Support Zone here.
It is normal for price action to pause after a series of key breakouts and prior to attempting another major breakout, this time above its 61.8 Fibonacci Retracement Fan Resistance Level which would turn its entire Fibonacci Retracement Fan sequence from resistance into support and clear the path to the upside. The short-term support zone which is located between 0.62035 and 0.62362 as marked by they grey rectangle in the chart, represents a multi-year low for the NZD/USD which is not supported by fundamentals; a choppy, longer term correction should be expected.
Today’s NFP report is expected to move the US Dollar and another major economic disappointment should deliver the fundamental catalyst to force the NZD/USD into a breakout above its 61.8 Fibonacci Retracement Fan Resistance Level. A confirmation by the Force Index will clear the path for price action to extend its rally into its resistance zone which is located between 0.64226 and 0.64542 as marked by the red rectangle. Volatility should be expected, but as long as the Force Index will remain above its ascending support level more, upside is likely. You can learn more about a Breakout, a Breakdown and the Resistance Zone here.
NZD/USD Technical Trading Set-Up - Breakout Extension Scenario
Long Entry @ 0.63150
Take Profit @ 0.64500
Stop Loss @ 0.62800
Upside Potential: 135 pips
Downside Risk: 35 pips
Risk/Reward Ratio: 3.86
A breakdown in the NZD/USD below its descending 50.0 Fibonacci Retracement Fan Support Level could result in a retracement back into its support zone form where more downside is not expected. Any potential price action reversal should be viewed as an excellent long-term buying opportunity as the fundamental picture suggests an advance in this currency pair, supported by technical factors.
NZD/USD Technical Trading Set-Up - Limited Reversal Scenario
Short Entry @ 0.62700
Take Profit @ 0.62100
Stop Loss @ 0.62950
Downside Potential: 60 pips
Upside Risk: 25 pips
Risk/Reward Ratio: 2.40

