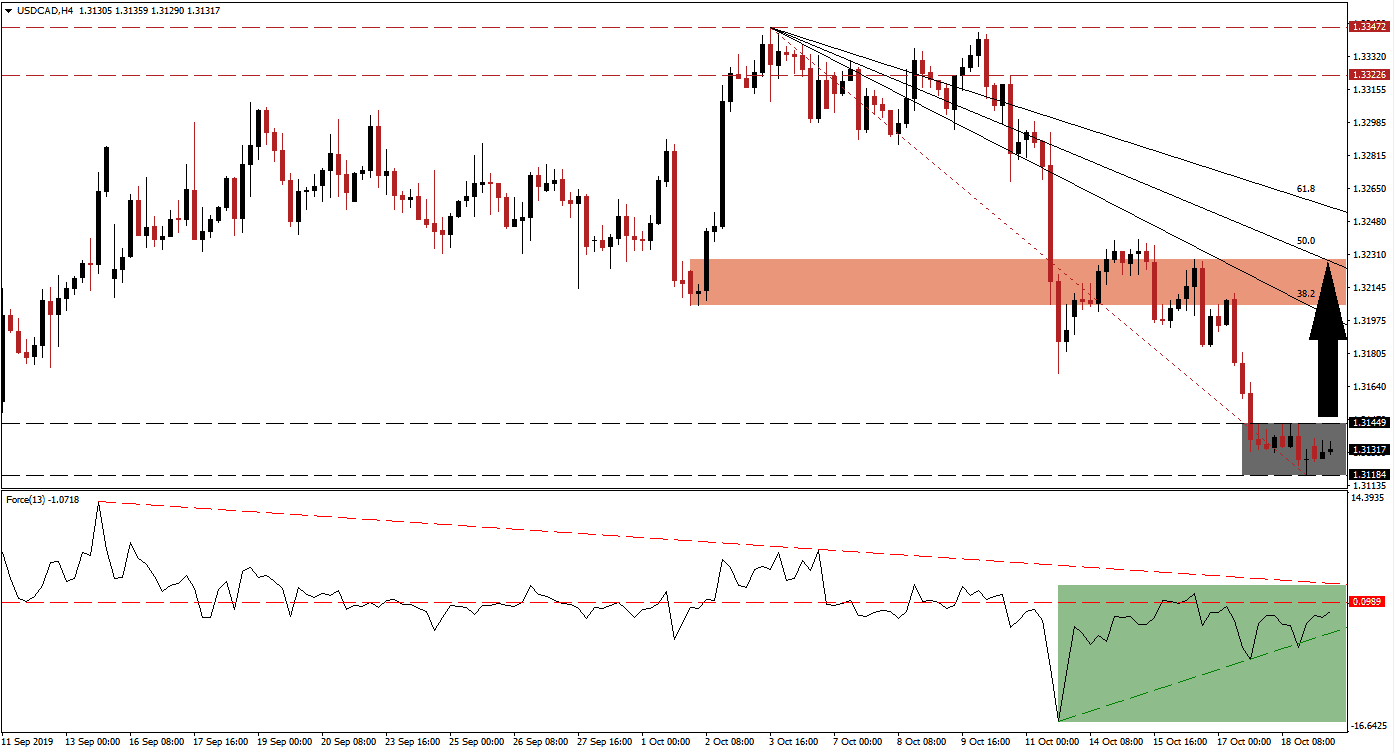
Canada heads to the polls today which may result in a pause in the Canadian Dollar’s strong performance against its bigger neighbour to the South, the US Dollar. Uncertainty of how the next Canadian government will look like could result in a short-term price action reversal in the USD/CAD, which currently started a sideways drift inside its support zone, up into its descending 50.0 Fibonacci Retracement Fan Resistance Level. Neither incumbent Prime Minister Trudeau nor main challenger, Conservative Party Leader Scheer, are close to the 170 seats required for a majority; this will allow Trudeau the first shot at forming a coalition government.
The Force Index, a next generation technical indicator, is flashing a buy signal as a positive divergence formed. This bullish development happens when price action is sliding while its underlying indicator is advancing. While the Force Index remains in negative conditions, momentum supported by its ascending support level is expected to force a breakout above its horizontal resistance level which would place this technical indicator in positive territory; this is marked by the green rectangle. The descending resistance level is additionally closing in on its horizontal resistance level and a push higher could result in a double breakout, leading to an advance in the USD/CAD. You can learn more about the Fibonacci Retracement Fan, the Force Index and the Support Zone here.
Bearish momentum in the USD/CAD is being depleted inside its support zone which is located between 1.31184 and 1.31449 as marked by the grey rectangle. A breakout in the Force Index above its horizontal resistance level, turning it back into support, should lead price action into a breakout above its support zone from where it can extend further to the upside. A confirmed advance above its intra-day low of 1.31706, which marks a previous low from a breakdown below its short-term support zone which turned it into resistance, is likely to deliver the final push to the upside. The long-term downtrend is expected to remain intact.

Upside potential for a short-term counter-trend reversal in the USD/CAD is likely to be limited to its next short-term resistance zone which is located between 1.32050 and 1.32286 as marked by the red rectangle. The 38.2 Fibonacci Retracement Fan Resistance Level has already moved below this zone while the 50.0 Fibonacci Retracement Fan Resistance Level is currently passing through it. A breakout above this short-term resistance zone would require a fundamental catalysts which remains absent. You can learn more about a Breakout, a Breakdown and the Resistance Zone here.
USD/CAD Technical Trading Set-Up - Short-Term Breakout Scenario
- Long Entry @ 1.31300
- Take Profit @ 1.32150
- Stop Loss @ 1.31000
- Upside Potential: 85 pips
- Downside Risk: 30 pips
- Risk/Reward Ratio: 2.83
Failure by the Force Index to extend its advance could pressure the USD/CAD into a breakdown below its support zone. While the long-term downtrend remains intact, a short-term reversal would ensure the longevity of it and the preliminary results of today’s Canadian election may provide the next fundamental catalyst. The next support zone is located between 1.30149 and 1.30436.
USD/CAD Technical Trading Set-Up - Breakdown Scenario
- Short Entry @ 1.30850
- Take Profit @ 1.30150
- Stop Loss @ 1.31100
- Downside Potential: 70 pips
- Upside Risk: 25 pips
- Risk/Reward Ratio: 2.80
