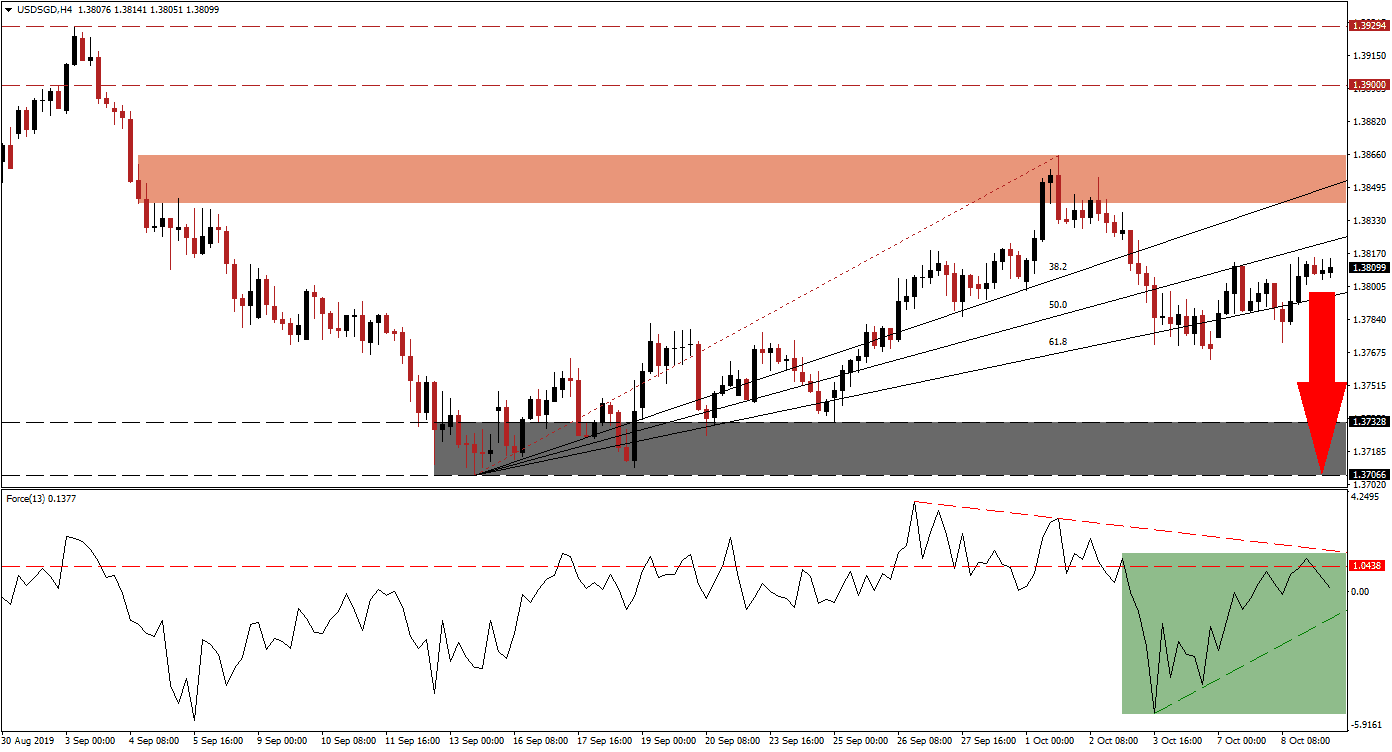
With prospects of a trade deal this week eradicated as a result of US actions against China, a slowing domestic US economy and a central bank expected to ease monetary policy further, the US Dollar looks into a rocky future. Forex traders viewed the US Dollar as a temporary safe haven as the trade war intensified, but this scenario is collapsing as fundamentals no longer support it. The USD/SGD broke down at the beginning of the month, which led to a series of breakdowns below the entire Fibonacci Retracement Fan sequence. Price action has now partially recovered the sell-off, but with bearish momentum on the rise, a fresh wave of sell orders is likely to follow as the downtrend remains intact.
The Force Index, a next generation technical indicator, is flashing a sell signal as bullish momentum is fading. After the USD/SGD approached its ascending 50.0 Fibonacci Retracement Fan Resistance Level, the Force Index reversed direction. Its descending resistance level added to downside pressures which forced this technical indicator below its horizontal support level, turning it into resistance; this is marked by the green rectangle. More downside is expected which is likely to lead price action into a breakdown below its 61.8 Fibonacci Retracement Fan Support Level. You can learn more about the Fibonacci Retracement Fan, the Force Index and the Support Zone here.
Forex traders should now monitor the USD/SGD as it is approaching its 61.8 Fibonacci Retracement Fan Support Level together with the Force Index as it closes in on its ascending support level. Price action pushed below its 61.8 Fibonacci Retracement Fan Support Level on two occasions, each time resulting in a higher low. While this represents a bullish trading signal on its own, other aspects of technical analysis don’t confirm this development. Each advance failed to record a high high and resistance levels held. In addition the fundamental picture suggests more US Dollar weakness ahead. Singapore has also attracted capital which fled Hong Kong which further enhances a stronger Singapore Dollar moving forward.

A breakdown below its 61.8 Fibonacci Retracement Fan Support Level will clear the path for the USD/SGD to correct into its next support zone which is located between 1.37066 and 1.37328 as marked by the grey rectangle. FOMC minutes released later in the US trading session may provide the next fundamental catalyst and is expected to show a divided FOMC in regards to the next adjustment in monetary policy. Markets are expecting another 25 basis point interest rate cut this month, following dismal manufacturing and service sector data out of the US. You can learn more about a Breakout, a Breakdown and the Resistance Zone here.
USD/SGD Technical Trading Set-Up - Breakdown Scenario
Short Entry @ 1.38150
Take Profit @ 1.37100
Stop Loss @ 1.38550
Downside Potential: 105 pips
Upside Risk: 40 pips
Risk/Reward Ratio: 2.63
An unexpected reversal in the Force Index above its twin resistance level could lead the USD/SGD into a breakout above its short-term resistance zone, located between 1.38418 and 1.38652 as marked by the red rectangle. A fundamental catalyst would be required, which is currently not visible. The next long-term resistance zone following a breakout is located between 1.39000 and 1.39294 which should be considered an excellent short-selling opportunity. The current technical picture suggests that the short-term resistance zone will hold, supported by fundamental developments.
USD/SGD Technical Trading Set-Up - Limited Breakout Scenario
Long Entry @ 1.38700
Take Profit @ 1.39200
Stop Loss @ 1.38450
Upside Potential: 50 pips
Downside Risk: 25 pips
Risk/Reward Ratio: 2.00
