USD/CAD: Will bearish momentum force a sell-off?
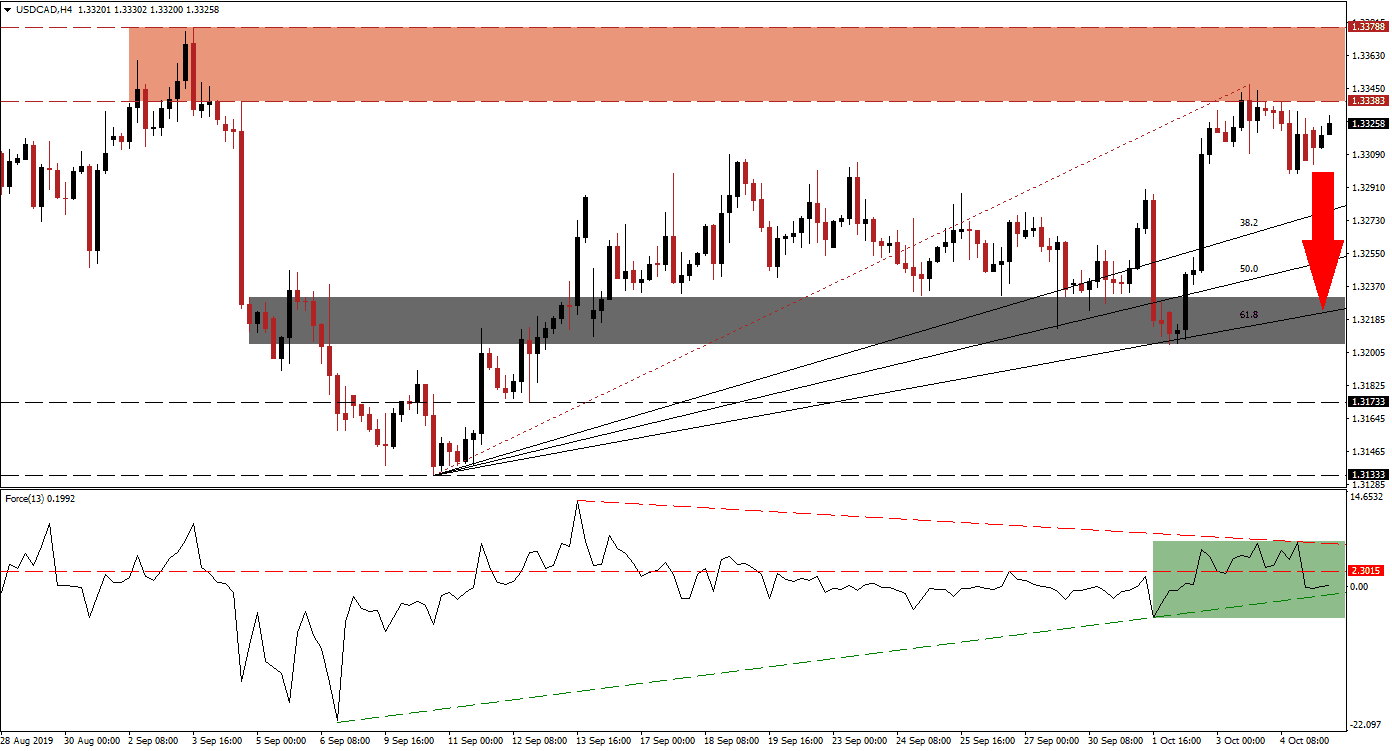
Following last Friday’s NFP report out of the US, the USD/CAD witnessed a rise in volatility just below its resistance zone. This allowed the Fibonacci Retracement Fan sequence to narrow the gap to price action, but overall bearish pressures are on the rise. The current intra-day high of 1.33472 represents a lower high as compared to its previous intra-day high of 1.33778, the top of its resistance zone. The increase in bearish momentum is expected to result in a breakdown below the 38.2 Fibonacci Retracement Fan Support Level, turning into resistance, from where more downside is expected.
The Force Index, a next generation technical indicator, formed a negative divergence which offers another red flag suggesting the uptrend in the USD/CAD is nearing an end. A negative divergence forms when price action increases while the underlying technical indicator decreases. After the Force Index reached its descending resistance level, it reversed and pushed below its horizontal support level, turning it into resistance. This technical indicator is now trading close to its ascending support level which is marked by the green rectangle. A breakdown below it is expected to lead price action into a sell-off. You can learn more about the Fibonacci Retracement Fan, the Force Index and the Support Zone here.
Forex traders should monitor price action as bullish pressures are receding just below the resistance zone; this zone is located between 1.33383 and 1.33778 as marked by the red rectangle. A breakdown in the Force Index below its ascending support level followed by the USD/CAD pushing below its intra-day low of 1.32986, the love following the release of the NFP report, is expected to result in a sell-off partially driven by profit taking. The US-China trade talks could act as an additional fundamental catalyst on top of expectations of a 25 basis point interest rate cut by the US Fed. Canadian elections on October 21st 2019 are adding to uncertainty, but to a far lesser degree than issues surrounding the US Dollar.
A confirmed breakdown below the 38.2 Fibonacci Retracement Fan Support Level should clear the path for the USD/CAD to contract into its next short-term support zone which is located between 1.32050 and 1.32306 as marked by the grey rectangle. The ascending 61.8 Fibonacci Retracement Fan Support Level is nestled inside this zone. Fundamental events such as the outcome of the US-China trade talks and the price of oil should be monitored together with the Force Index, a rise in bearish pressures could result in a breakdown below its short-term support zone and extend the sell-off into its long-term support zone located between 1.31333 and 1.31733. You can learn more about a Breakout, a Breakdown and the Resistance Zone here.
USD/CAD Technical Trading Set-Up - Breakdown Scenario
Short Entry @ 1.33250
Take Profit @ 1.32100
Stop Loss @ 1.33550
Downside Potential: 115 pips
Upside Risk: 30 pips
Risk/Reward Ratio: 3.83
In the event that the ascending support level in the Force Index will result in a reversal and if the USD/CAD can eclipse its intra-day high of 1.33472, located inside its resistance zone, more upside could follow. A fundamental catalyst would be required together with a double breakout in the Force Index. The next resistance zone is located between 1.34317 and 1.35015; this should be viewed as an excellent short selling opportunity as the fundamental scenario favors a weaker USD/CAD.
USD/CAD Technical Trading Set-Up - Limited Breakout Scenario
Long Entry @ 1.33900
Take Profit @ 1.34600
Stop Loss @ 1.33550
Upside Potential: 70 pips
Downside Risk: 35 pips
Risk/Reward Ratio: 2.00

