USD/JPY: Will sell-off extend into its support zone?
The US Dollar failed to advance against the Japanese Yen despite Friday’s NFP report out of the US for the month of September. Many analysts referred to it as a “goldilocks” report, not bad enough to suggests the economic slowdown impacted hiring and not good enough to derail the US Fed from cutting interest rates by 25 basis points this month. Digging through the details of the report did suggest early warning signs and it was the second consecutive NFP report which showed weakness. The USD/JPY managed to briefly pierce above its 61.8 Fibonacci Retracement Fan Resistance Level, before retreating below it.
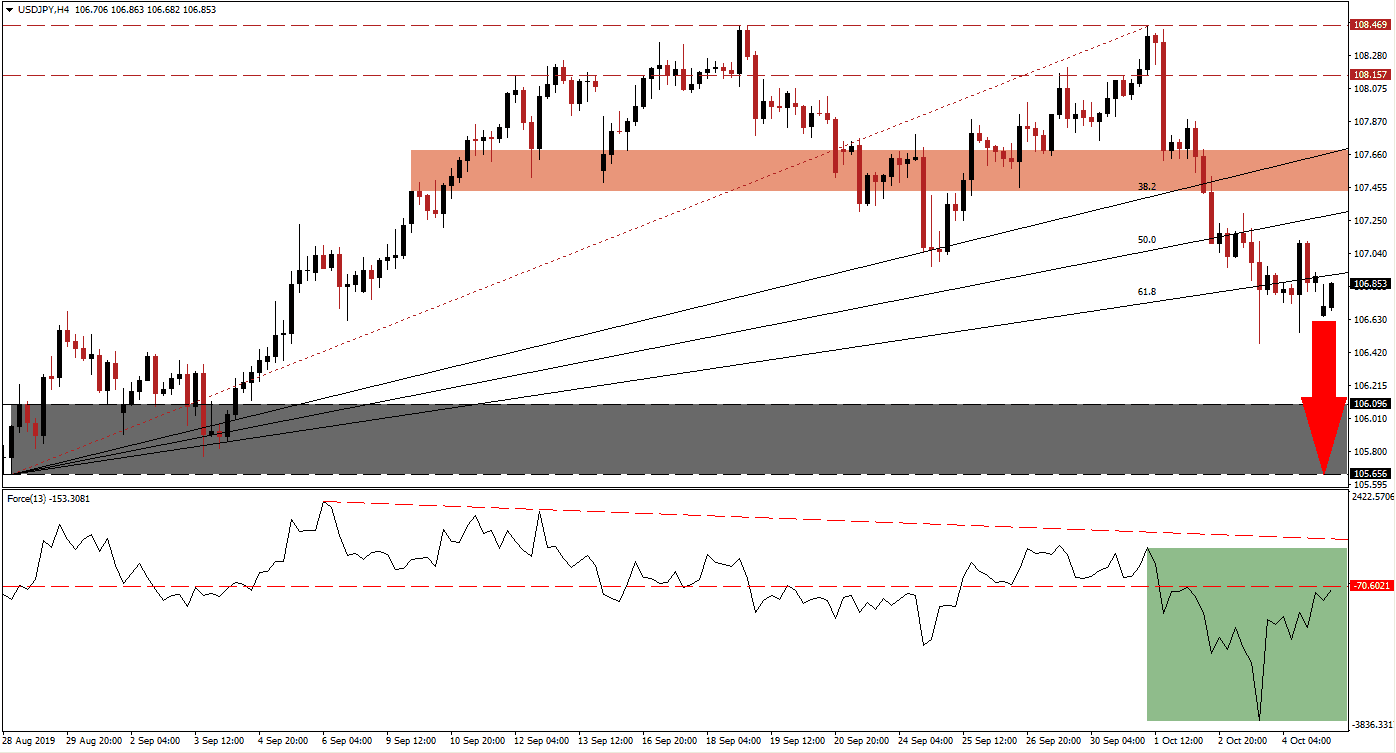
The Force Index, a next generation technical indicator, plunged to a new low as price action completed a breakdown from its long-term resistance zone through its entire Fibonacci Retracement Fan sequence; this turned it from support into resistance. This technical indicator has since recovered from its lows, but it remains in negative territory and below its horizontal resistance level as bears remain in control of price action in the USD/JPY. This is marked by the green rectangle and a descending resistance level is also approaching. You can learn more about the Fibonacci Retracement Fan, the Force Index and the Support Zone here.
While volatility is expected to increase as the USD/JPY is testing its new ascending resistance level, the rise in geopolitical tensions is supporting a stronger Japanese Yen while the prospects of yet another interest rate cut out of the US is limiting further strengthening in the US Dollar. Forex traders should now monitor the intra-day low of 106.481 and the intra-day high of 107.124, both levels represent the highs and lows of price action moves above-and-below the 61.8 Fibonacci Retracement Fan Resistance Level and could create the nest short-term resistance zone.
An extension of the longer-term sell-off is expected to resume which should take the USD/JPY back into its next support zone which is located between 105.656 and 106.096 as marked by the grey rectangle. As long as the Force Index will remain in negative conditions and below its descending resistance level while price action will remain below the 107.124 mark, the downtrend will remain intact. This week’s US-China trade talks, which are already under a threat of a negative outcome, are expected to add to uncertainty in financial markets which favor a stronger Japanese Yen on the back of safe haven demand. You can learn more about a Breakout, a Breakdown and the Resistance Zone here.
USD/JPY Technical Trading Set-Up - Breakdown Extension Scenario
Short Entry @ 106.850
Take Profit @ 105.700
Stop Loss @ 107.200
Downside Potential: 115 pips
Upside Risk: 35 pips
Risk/Reward Ratio: 3.29
Upside potential in the USD/JPY is currently limited to its short-term resistance zone which is located between 107.431 and 107.685 as marked by the red rectangle. The 38.2 Fibonacci Retracement Fan Resistance Level is currently passing through this zone and given the fundamental picture, a breakout above this zone is not expected. Any push into resistance should be viewed as a good entry opportunity for a short position, unless the Force Index completes a breakout above its descending resistance level and advances into positive territory.
USD/JPY Technical Trading Set-Up - Limited Breakout Scenario
Long Entry @ 107.300
Take Profit @ 107.650
Stop Loss @ 107.150
Upside Potential: 35 pips
Downside Risk: 15 pips
Risk/Reward Ratio: 2.33

