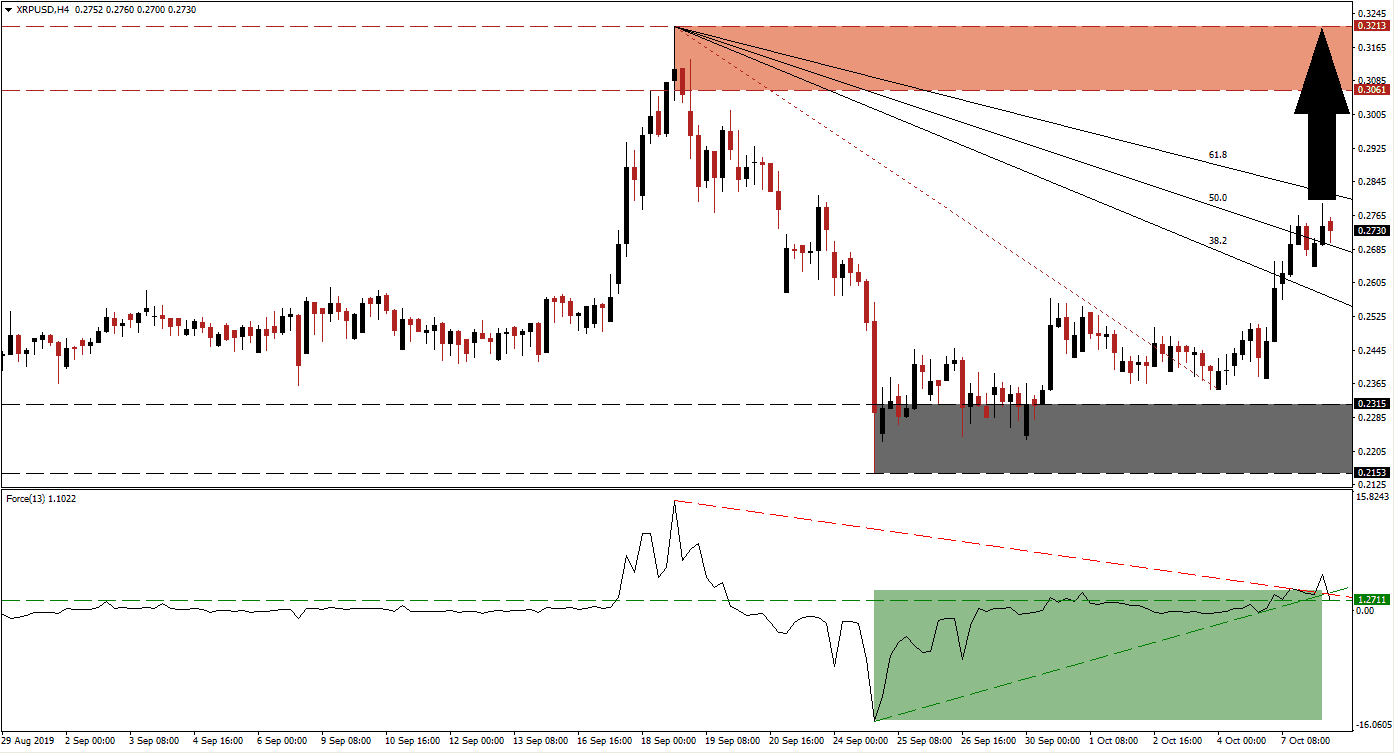
Ripple has advanced after the Bitcoin inspired cryptocurrency sell-off left XRP/USD in extreme oversold conditions. Fundamentals for Ripple are solid as the company continues to expand its operations as well as offerings. The sharp sell-of resulted in an intra-day low of 0.2153 from where bullish momentum started to build-up. The drift higher resulted in the re-drawing of the Fibonacci Retracement Fan sequence to its higher intra-day low of 0.2351; this low was formed following the breakout above its support zone and subsequent reversal before price action spiked to the upside.
The Force Index, a next generation technical indicator, confirmed the sharp increase in bullish momentum with a quick recovery of its own. A steep, ascending support level formed as the XRP/USD completed a breakout above its support zone. The Force Index was lifted above its horizontal resistance level, turning it into support, and briefly above its descending resistance level. As price action is pausing its advance, this technical indicator dropped below its descending resistance level as well as below its ascending support level and into its horizontal support level which is marked by the green rectangle. You can learn more about the Fibonacci Retracement Fan, the Force Index and the Support Zone here.
Following the breakout above its descending 38.2 and 50.0 Fibonacci Retracement Fan Resistance Level which turned both into support, a breather in the advance is normal. As the cryptocurrency market is recovering from the sell-off after the Bitcoin hashrate experienced a flash crash, the rise in overall bullish sentiment is expected to provide XRP/USD with the necessary bullish spark to complete one final breakout above its 61.8 Fibonacci Retracement Fan Resistance Level which will clear the path into its next resistance zone. A breakout in the Force Index is likely to lead price action higher.
Traders should monitor the intra-day high of 0.2794 which marks the current peak of the breakout sequence in this cryptocurrency pair. A confirmed move above this level will also place XRP/USD above its 61.8 Fibonacci Retracement Fan Resistance Level which is expected to attract fresh net buy orders. The next resistance zone is located between 0.3061 and 0.3213 which is marked by the red rectangle. Heavy resistance is expected inside this zone and a fundamental catalyst would be required in order to extend the advance. You can learn more about a Breakout, a Breakdown and the Resistance Zone here.
XRP/USD Technical Trading Set-Up - Breakout Extension Scenario
Long Entry @ 0.27250
Take Profit @ 0.32000
Stop Loss @ 0.26000
Upside Potential: 475 pips
Downside Risk: 125 pips
Risk/Reward Ratio: 3.80
In the event of a surge in bearish pressures from its descending 61.8 Fibonacci Retracement Fan Resistance Level, confirmed by a collapse in the Force Index, a retracement of the breakout should follow. The next support zone is located between 0.2153 and 0.2315 which is marked by the grey rectangle. While a sell-off is currently not supported, any potential retreat in the XRP/USD should be considered a very good buying opportunity as the fundamental picture favors an extension of the advance, supported by technical aspects.
XRP/USD Technical Trading Set-Up - Limited Reversal Scenario
Short Entry @ 0.25600
Take Profit @ 0.23150
Stop Loss @ 0.26500
Downside Potential: 245 pips
Upside Risk: 90 pips
Risk/Reward Ratio: 2.72

