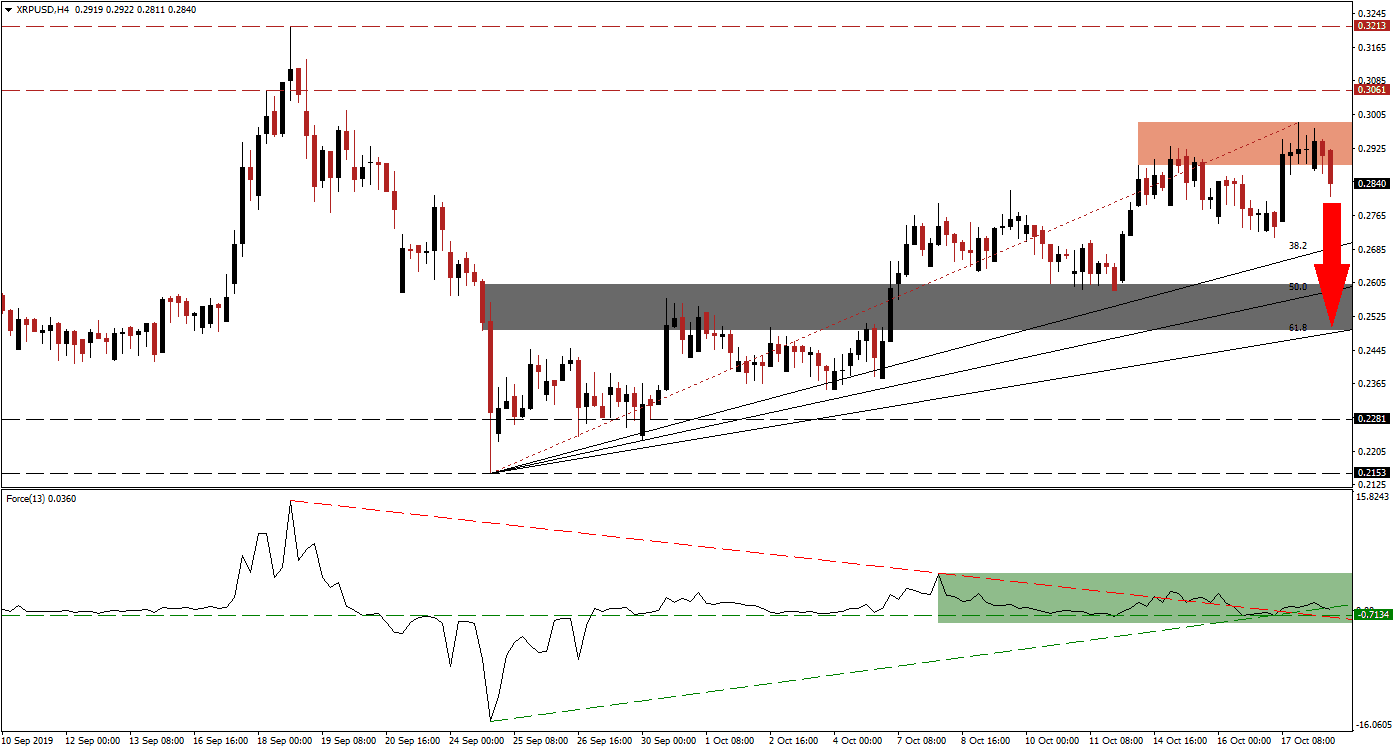
While Bitcoin has dragged down the overall cryptocurrency market, Ripple managed to outperform as solid fundamental overcame peer pressure. The steady advance in the XRP/USD, well supported by its re-drawn Fibonacci Retracement Fan sequence has now completed a breakdown below its newly formed short-term resistance zone as the upside potential is exhausted. Long-term fundamental support an extended advance, but the current drag on the cryptocurrency market is having a short-term impact on price action.
The Force Index, a next generation technical indicator, entered a sideways trend as XRP/USD extended its advance which indicates that bullish momentum is weak. The Force Index is currently maintaining its position above its horizontal support level and remains above the 0 center line as marked by the green rectangle. It’s ascending support level and its descending resistance level have crossed, with this technical indicator just below its ascending support level. The Force Index is expected to temporarily move below its horizontal support level and into its descending resistance level, supporting a short-term price action reversal, before potentially resuming its advance. You can learn more about the Fibonacci Retracement Fan, the Force Index and the Support Zone here.
Volatility following the breakdown below its short-term resistance zone, located between 0.2883 and 0.2986 as marked by the red rectangle, is likely to remain elevated as fundamental factors are fighting technical elements. Traders should monitor the Force Index together with the intra-day high of 0.2824 which represent the previous peak which led to a reversal close to its ascending 38.2 Fibonacci Retracement Fan Support Level; a move below this mark is likely to increase selling pressure on XRP/USD and extend the current breakdown.
As long-term fundamentals for Ripple remain bullish, a sell-off is expected to be limited to its next short-term support zone which is located between 0.2493 and 0.2604 as marked by the grey rectangle. The 50.0 Fibonacci Retracement Fan Support Level is currently located at the top range of this zone with the 61.8 Fibonacci Retracement Fan Support Level at the bottom range of it. A move by XRP/USD into this zone will keep the long-term uptrend intact and should be considered a solid buying opportunity. You can learn more about a Breakout, a Breakdown and the Resistance Zone here.
XRP/USD Technical Trading Set-Up - Breakdown Extension Scenario
Short Entry @ 0.2845
Take Profit @ 0.2500
Stop Loss @ 0.2950
Downside Potential: 345 pips
Upside Risk: 105 pips
Risk/Reward Ratio: 3.29
In case the Force Index reverses of its horizontal support level and pushed to a higher high, XRP/USD is expected to follow through with a breakout above its short-term resistance zone. A confirmed move above its intra-day high of 0.2986, the current end point of its re-drawn Fibonacci Retracement Fan sequence, will clear the path into its next long-term resistance zone. This zone is located between 0.3061 and 0.3213 which has rejected the previous two attempts of a breakout.
XRP/USD Technical Trading Set-Up - Breakout Scenario
Long Entry @ 0.3000
Take Profit @ 0.3200
Stop Loss @ 0.2915
Upside Potential: 200 pips
Downside Risk: 85 pips
Risk/Reward Ratio: 2.35

