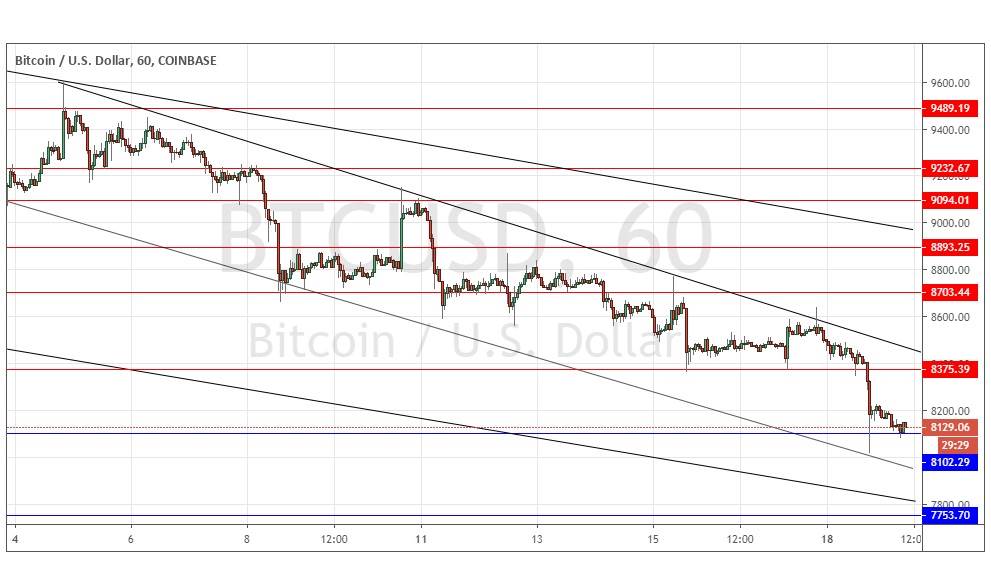
Bitcoin: Double bearish price channels continue
Yesterday’s signals were not triggered as the support level at $8,102 produced no bounce before 5pm Tokyo time.
Today’s BTC/USD Signals
Risk 0.75% per trade.
Trades must be taken prior to 5pm Tokyo time Wednesday.
Long Trade Idea
⦁ Go long after a bullish price action reversal on the H1 time frame following the next touch of $7,754.
⦁ Place the stop loss 1 pip below the local swing low.
⦁ Move the stop loss to break even once the trade is $50 in profit by price.
⦁ Remove 50% of the position as profit when the trade is $50 in profit by price and leave the remainder of the position to run.
Short Trade Ideas
⦁ Go short after a bearish price action reversal on the H1 time frame following the next touch of $8,375 or $8,703.
⦁ Place the stop loss 1 pip above the local swing high.
⦁ Move the stop loss to break even once the trade is $50 in profit by price.
⦁ Remove 50% of the position as profit when the trade is $50 in profit by price and leave the remainder of the position to run.
The best method to identify a classic “price action reversal” is for an hourly candle to close, such as a pin bar, a doji, an outside or even just an engulfing candle with a higher close. You can exploit these levels or zones by watching the price action that occurs at the given levels.
BTC/USD Analysis
I wrote yesterday that the technical picture had become even more bearish, with the price making room to fall all the way down to $8,102 before hitting any major support.
I took a bearish bias as long as the price was making new low prices below $8,630.
This was a great call as the price broke below that level during the New York session and fell quickly to the support level at $8,102 just as I forecasted.
The price is now sitting on that support, which has held over the past few hours. It is too early to be bullish really, but the price might stabilize here for a while.
Technically, we can draw a narrower bearish price channel within the wider bearish price channel.
The picture is bearish, but I would want to see a retracement to a key resistance level before taking another short trade.
The lower support level shown in the chart at $7,754 could become a very interesting point as long-term buyers could step in there, due to its confluence with the lower channel trend line and the psychological quarter-level at $7,750. There is nothing of high importance due today concerning the USD.
