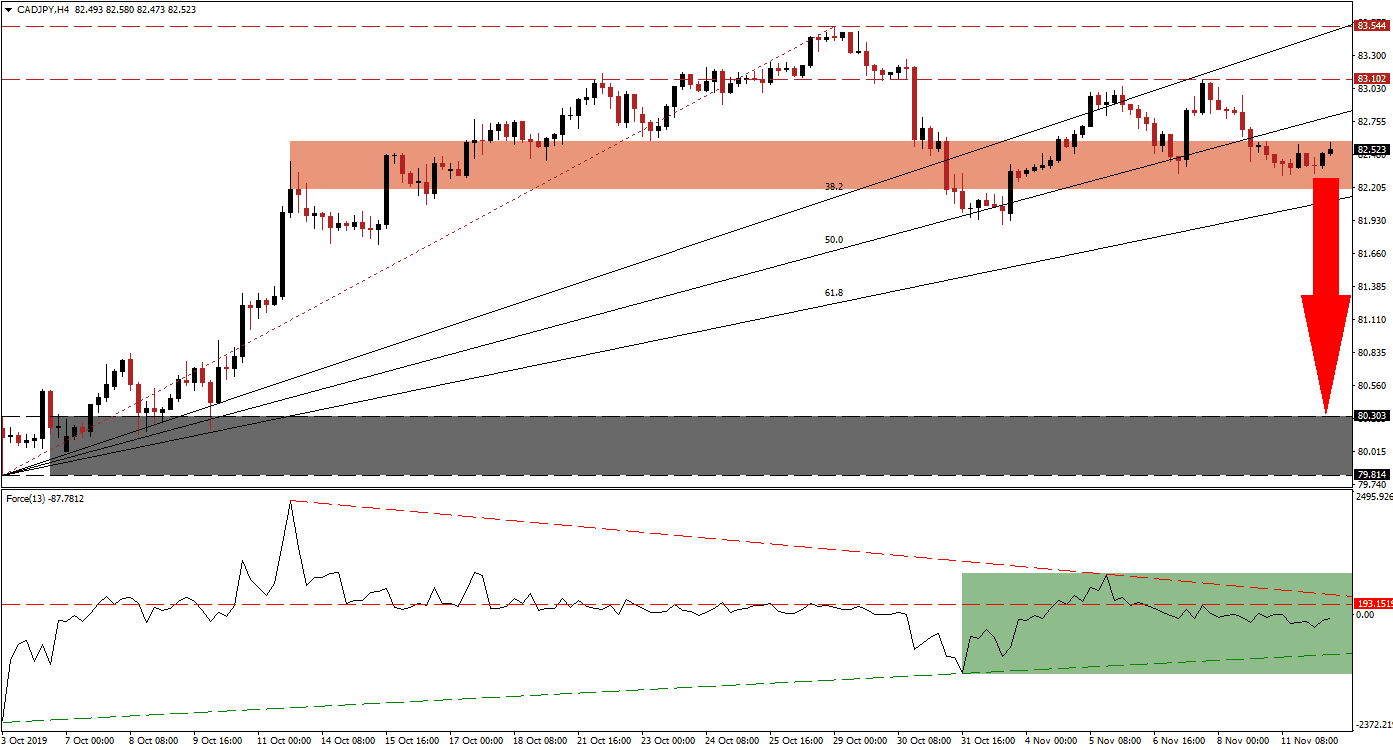
Global trade uncertainty, a potential Bank of Canada interest rate cut and mixed Japanese economic data has created a volatile trading environment for the CAD/JPY. Despite economic data out of Japan which has been mixed, safe-haven demand is adding to capital inflows in the Japanese Yen while the Canadian Dollar is holding its gains through a looming interest rate cut by the Canadian central bank. This led to a breakdown in this currency pair below its long-term resistance zone, but the 50.0 Fibonacci Retracement Fan Support Level reversed price action to a lower high. The current reversal has led to a breakdown below the 50.0 Fibonacci Retracement Fan Support Level and turned it into resistance, confirming the short-term resistance zone.
The Force Index, a next-generation technical indicator, confirms dominant bearish momentum which is expected to drive this currency pair to the downside. After the CAD/JPY completed the breakdown below its resistance zone, the Force Index plunged below its horizontal support level, turned it into resistance, and then extended the decline into its ascending support level. The reversal was limited to its descending resistance level and this technical indicator remains in negative territory which suggests that bears are in control of price action. As the descending resistance level is approaching the horizontal resistance level, marked by the green rectangle, a breakdown in the Force Index is likely to lead price action to a breakdown of its own. You can learn more about the Force Index here.
With the confirmation of the short-term resistance zone, located between 82.194 and 82.588 as marked by the red rectangle, bearish pressures are on the rise and the CAD/JPY is vulnerable to a breakdown. This zone is nestled between its 61.8 Fibonacci Retracement Fan Support Level and its 50.0 Fibonacci Retracement Fan Resistance Level, and a breakdown below it will clear the path for a bigger correction to the downside. A profit-taking sell-off may also emerge and provide more downside pressure, especially if the current fundamental scenario remains in place.
Forex traders should monitor the Force Index as it is nearing a twin resistance level, and while a short-term development could spike this currency pair into its long-term resistance zone between 83.102 and 83.544, the bearish outlook remains dominant. Given the proximity of the 61.8 Fibonacci Retracement Fan Support Level to its short-term resistance zone, a double breakdown is expected to take the CAD/JPY down into its next support zone, supported by fundamental factors. The next support zone is located between 79.814 and 80.303 as marked by the grey rectangle. You can learn more about a breakdown here.
CAD/JPY Technical Trading Set-Up - Breakdown Scenario
⦁ Short Entry @ 82.500
⦁ Take Profit @ 80.250
⦁ Stop Loss @ 83.000
⦁ Downside Potential: 225 pips
⦁ Upside Risk: 50 pips
⦁ Risk/Reward Ratio: 4.50
In the event of a breakout in the Force Index above its descending resistance level, the CAD/JPY may be pressured back into its long-term resistance zone which previously rejected a breakout. Unless a fresh fundamental catalyst emerges, a breakout remains unlikely but the next resistance zone awaits price action between 84.065 and 84.349. An advance into this zone should be taken advantage of as it represents a great long-term short-selling opportunity.
CAD/JPY Technical Trading Set-Up - Limited Breakout Scenario
⦁ Long Entry @ 83.600
⦁ Take Profit @ 84.250
⦁ Stop Loss @ 83.300
⦁ Upside Potential: 65 pips
⦁ Downside Risk: 30 pips
⦁ Risk/Reward Ratio: 2.17

