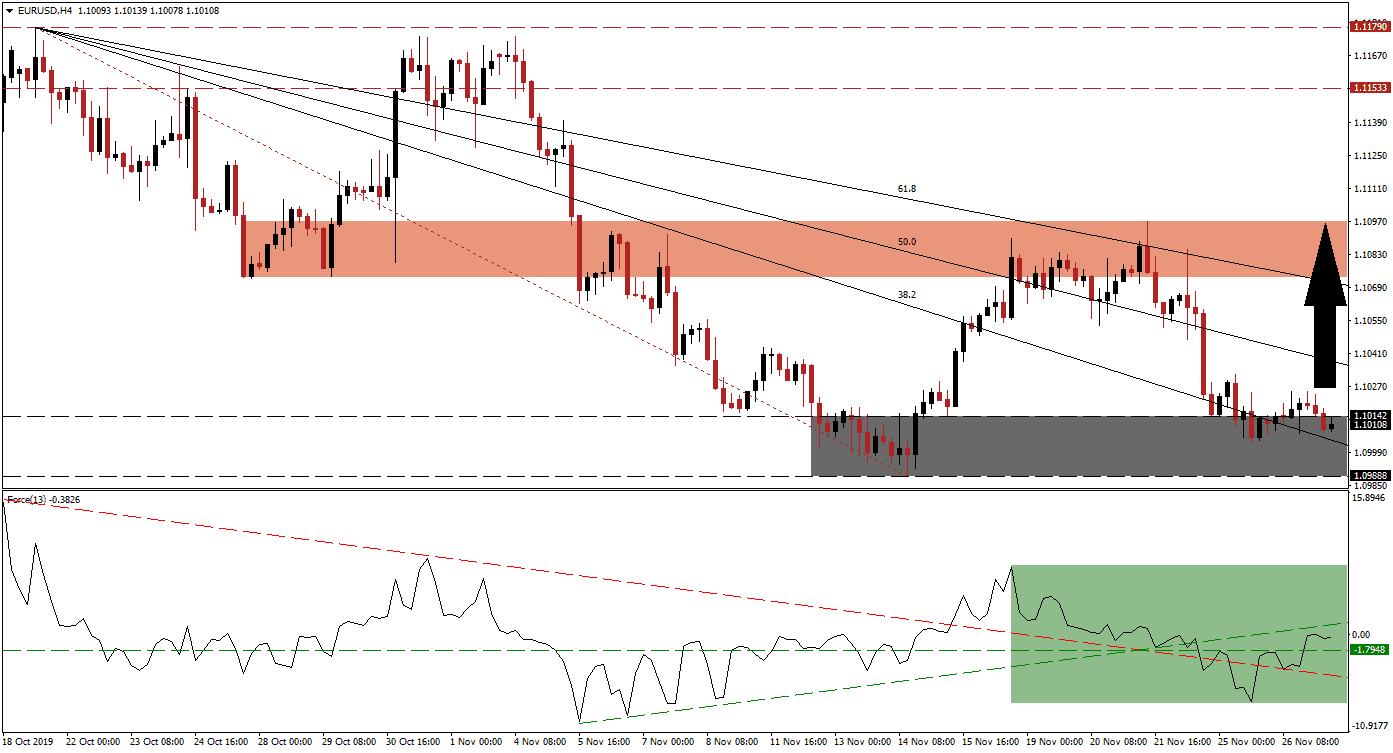
Economic data out of the Eurozone has been mixed with a bearish bias, mirrored by the US. This has led to an increase in volatility in the EUR/USD, but following the rejection of its most recent advance, bullish momentum started to rise. Several key economic reports out of the US are expected to provide the next short-term fundamental catalyst as US-China trade negotiations together with the unrest in Hong Kong remain dominant factors. This currency pair reversed back down into its support zone, but a higher low has formed and will be confirmed if the rise in bullish momentum will lead to a breakout.
The Force Index, a next-generation technical indicator, confirmed the increase in volatility as the EUR/USD is being pulled and pushed in either direction. Following the initial peak of the breakout in this currency pair above its support zone, the Force Index started to contract. This led to a breakdown below its ascending support level which currently acts as temporary support; a breakdown below its descending resistance followed and converted it into temporary resistance. This technical indicator pushed through its horizontal resistance level and turned it into support as marked by the green rectangle. The Force Index is now anticipated to move into positive conditions and place bulls in charge of price action. You can learn more about the Force Index here.
Taking the US Federal Reserve into consideration, the long-term fundamental outlook for the EUR/USD remains bullish. The US central bank has been pumping cash into the domestic inter-bank market as shortfalls appeared in September and more interest rate cuts remain an option together with its balance sheet expansion. This currency pair has stabilized inside its support zone, located between 1.09888 and 1.10142 as marked by the grey rectangle; the descending 38.2 Fibonacci Retracement Fan Support Level has entered this zone. A move above the intra-day high of 1.10249, the previous peak if the reversed breakout attempt, is additionally favored to ignite a short-covering rally.
Price action is anticipated to push through its Fibonacci Retracement Fan sequence as a result of the expected short-covering rally. The next short-term resistance zone awaits this currency pair between 1.10731 and 1.10967 as marked by the red rectangle. Aside from today’s US economic data, another short-term fundamental influencer is expected from news flow surrounding the official start of the holiday shopping season which starts with this week’s Black Friday event. The reported contraction in consumer confidence could derail a necessary economic event and the next long-term resistance zone for the EUR/USD is located between 1.11533 and 1.1170.
EUR/USD Technical Trading Set-Up - Breakout Scenario
⦁ Long Entry @ 1.10100
⦁ Take Profit @ 1.10950
⦁ Stop Loss @ 1.09850
⦁ Upside Potential: 85 pips
⦁ Downside Risk: 25 pips
⦁ Risk/Reward Ratio: 3.40
Should the Force Index push through its descending resistance level, currently acting as temporary support, a breakdown in the EUR/USD may follow. Due to the current long-term fundamental scenario supported by the short-term technical picture, the downside potential remains limited. The next support zone awaits price action between 1.08789 and 1.09126; this represents a good buying opportunity for this currency pair and should not be ignored.
EUR/USD Technical Trading Set-Up - Limited Breakdown Scenario
⦁ Short Entry @ 1.09650
⦁ Take Profit @ 1.09000
⦁ Stop Loss @ 1.09900
⦁ Downside Potential: 65 pips
⦁ Upside Risk: 25 pips
⦁ Risk/Reward Ratio: 2.60


