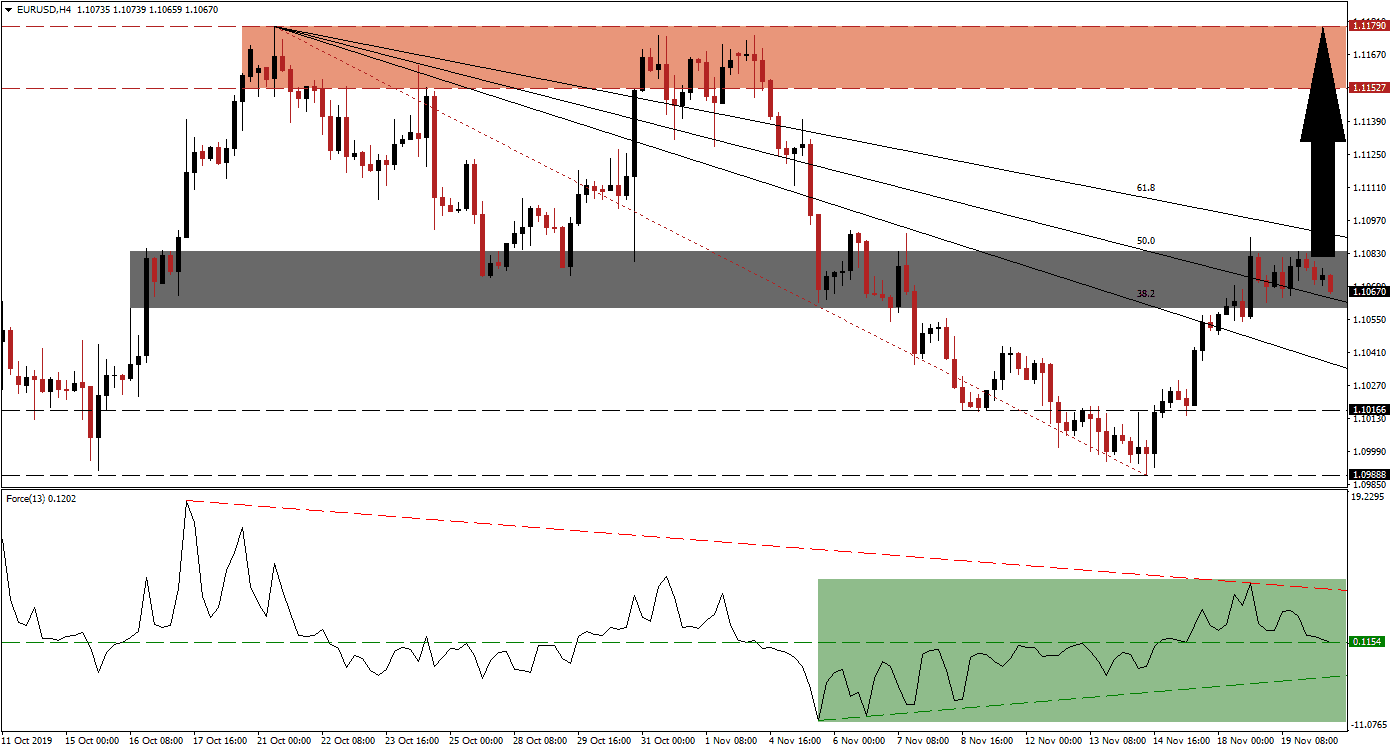
Fundamental differences between the US and China are evident which places the phase one trade truce in jeopardy. US President Trump’s threat of new tariffs unless China agrees to US terms is unlikely to move the process in the right direction, neither is the passage of a bill concerning Hong Kong. Japanese data showed that global trade remains significantly weaker than economists expect and the EUR/USD is currently inside of its short-term support zone from where the next move in price action is developing. You can learn more about a support zone here.
The Force Index, a next-generation technical indicator, indicates the presence of expanding bullish momentum that accompanied the EUR/USD following the breakout above its long-term support zone. The Force Index was rejected by its descending resistance level but remains above its horizontal support level and in positive conditions as marked by the green rectangle. Its ascending support level is adding bullish pressures on price action and this technical indicator is likely to push through its descending resistance level, leading this currency pair to a double breakout of its own.
After the breakout above its long-term support zone, located between 1.09888 and 1.10166, the EUR/USD quickly accelerated through its descending 38.2 and 50.0 Fibonacci Retracement Fan Resistance Levels and into its next short-term support zone. Price action has paused, which is normal after the solid advance. More upside is expected, supported by fundamental factors, and this currency pair is likely to complete a breakout above its short-term support zone, located between 1.10595 and 1.10836 as marked by the grey rectangle. The proximity of the 61.8 Fibonacci Retracement Fan Resistance Level makes a double breakout possible which will clear the path to the upside into its next resistance zone. You can read more about the Fibonacci Retracement Fan here.
An unorthodox fundamental support factor for the Euro is provided by the US Federal Reserve as a result of the collateral impact due to its balance sheet expansion. The accompanied US Dollar weakness has in the past indicated Euro strength. The US economy is additionally expected to underperform the global economy by over one percentage point in 2020. This should allow the EUR/USD to extend its breakout sequence until it can test the strength of its next resistance zone, located between 1.11527 and 1.11790 as marked by the red rectangle; a further breakout is likely unless the current fundamental picture changes materially.
EUR/USD Technical Trading Set-Up - Breakout Extension Scenario
⦁ Long Entry @ 1.10700
⦁ Take Profit @ 1.11750
⦁ Stop Loss @ 1.10450
⦁ Upside Potential: 105 pips
⦁ Downside Risk: 25 pips
⦁ Risk/Reward Ratio: 4.20
Should the Force Index push below its horizontal support level, turning it into resistance, and into negative territory, the EUR/USD may be pressured below its short-term support zone.; the ascending support level should be monitored closely. Due to the current fundamental scenario which remains supported by technical aspects, the downside is expected to remain limited to its long-term support zone; any descend into it should be considered an excellent long-term buying opportunity.
EUR/USD Technical Trading Set-Up - Limited Breakdown Scenario
⦁ Short Entry @ 1.10250
⦁ Take Profit @ 1.09900
⦁ Stop Loss @ 1.10400
⦁ Downside Potential: 35 pips
⦁ Upside Risk: 15 pips
⦁ Risk/Reward Ratio: 2.33


