The difference between success and failure in Forex trading is very likely to depend upon which currency pairs you choose to trade each week, and not on the exact trading methods you might use to determine trade entries and exits. Each week I am going to analyze fundamentals, sentiment and technical positions in order to determine which currency pairs are most likely to produce the easiest and most profitable trading opportunities over the next week. In some cases, it will be trading the trend. In other cases, it will be trading support and resistance levels during more ranging markets.
Big Picture 24th November 2019
In my previous piece last week, I forecasted that the best trade would be buying any relatively shallow dips in the S&P 500 Index, using tight stop losses. This was an OK call and should have led to profitable trades overall, with the Index ending the week up from its open on Monday by 0.07%.
Last week’s Forex market saw the strongest rise in the relative value of the U.S. Dollar, and the strongest fall in the relative value of the Swiss Franc, but the values were small.
Fundamental Analysis & Market Sentiment
Fundamental analysts are tilting in favor of the view that last month’s quarter-point cut in the U.S. interest rate will be the last cut for a while, with Jerome Powell signaling there are likely to be no further cuts in a while upbeat on the U.S. economy.
The U.S. economy is still growing, but there are some fears of a pending recession. However, the benchmark U.S. stock index, the S&P 500, ended the week not far from its all-time high price. However, there are increasing fears over progress towards a U.S. – China trade deal due to tensions over Hong Kong. The U.S. Dollar rose a little over the week.
The Forex market is currently in a minor “risk off” mode, as the U.S. Dollar and Japanese Yen are strengthening at the expense of almost every other major currency. There are no strong trends currently in the Forex market.
Technical Analysis
U.S. Dollar Index
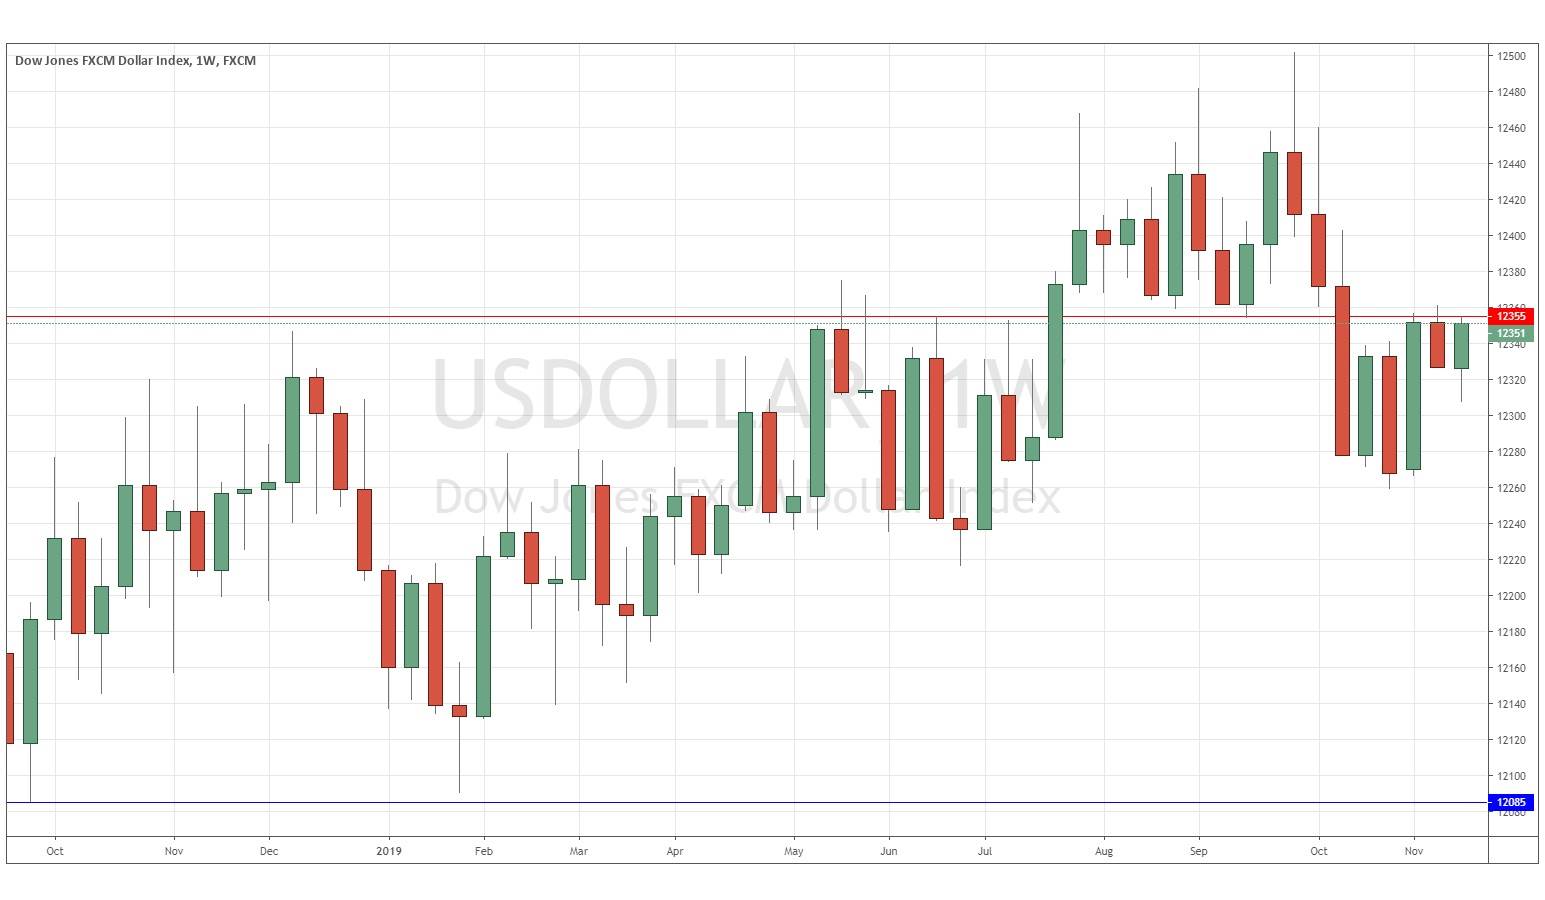
The weekly price chart below shows last week printed a small bullish candlestick, which closed just below the resistance level at 12355, but also closed very close to the top of its price range. The price is below its level from 3 months ago, but above its level from 6 months ago as well as the resistance level. This suggests that despite the weak long-term bullish trend, next week’s action is unpredictable.
EUR/USD
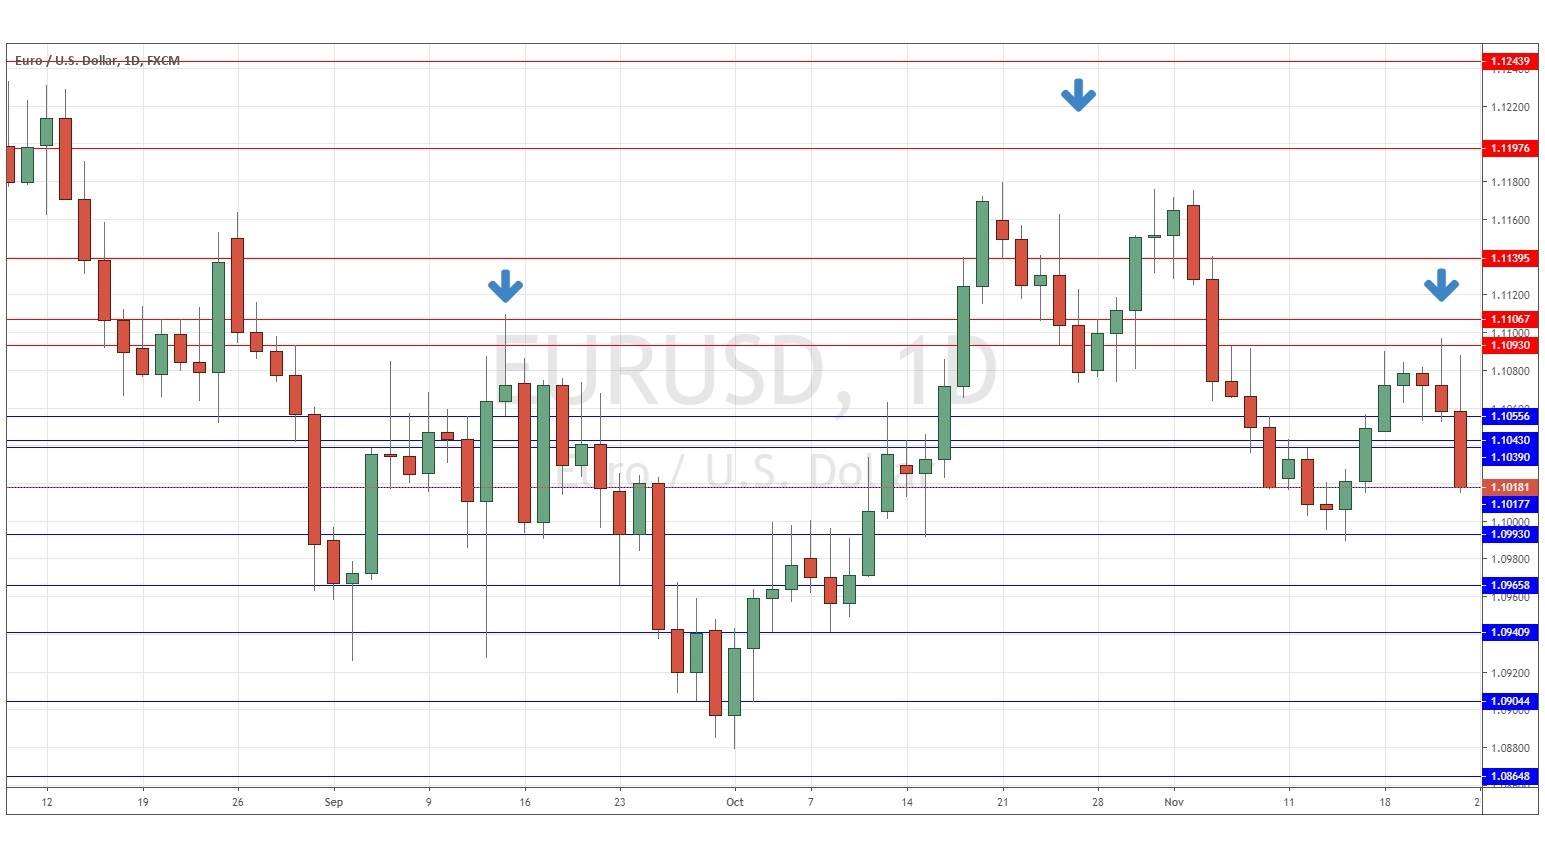
The daily price chart below shows that we may be seeing the completion of a bearish head and shoulders pattern, with the relevant neckline level at 1.0993. The weekly chart printed a bearish candlestick which closed right on its low a little way above 1.1000. The price is below its levels from both 3 and 6 months ago. These are all bearish signs. Therefore, I would look for a short trade once the support level at 1.0993 is decisively broken, but bears should watch the multi-month low price below that at 1.0879 for a major bullish reversal.
Conclusion
This week I forecast the best trade is likely to be short EUR/USD following a daily (New York) close below 1.0993.


