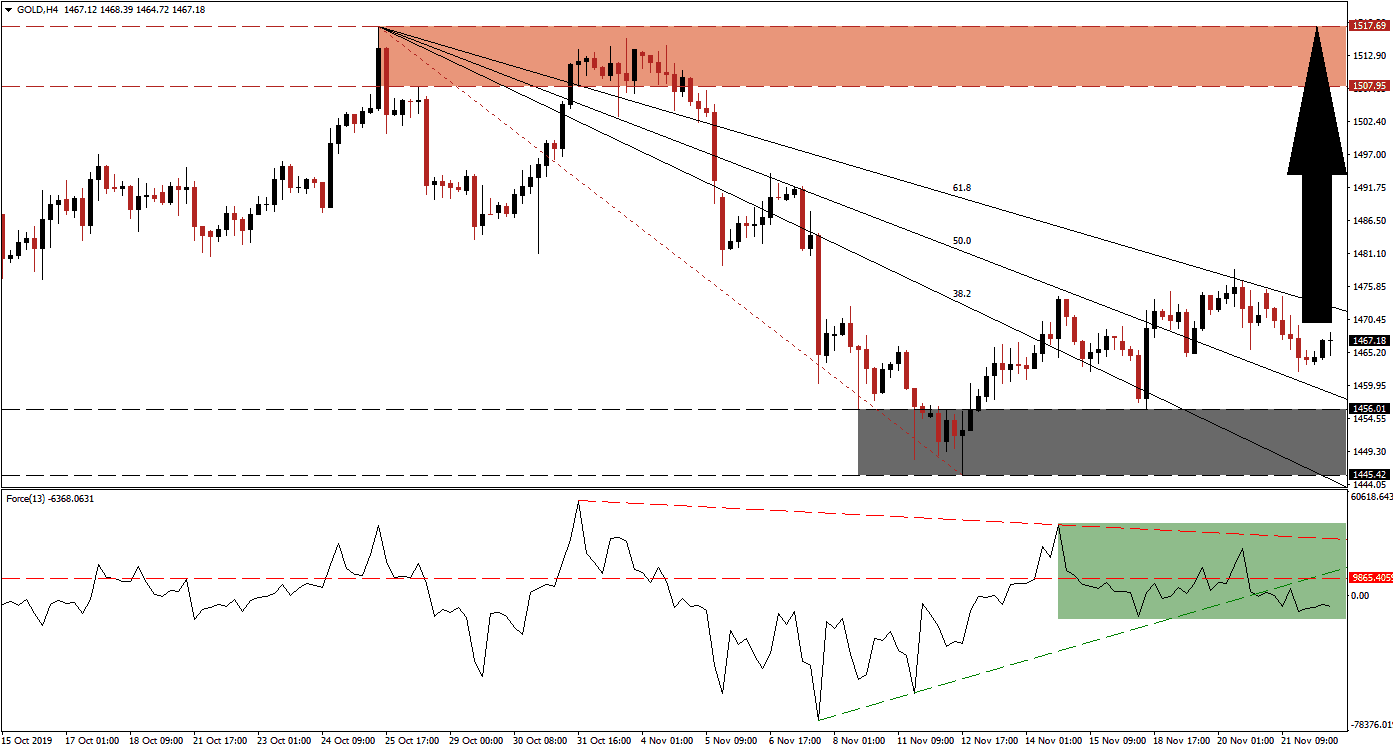
With trade tension on the rise once again after US President Trump threatened more tariffs unless China accepts US demands and China pessimistic about a significant trade deal, safe-haven assets such as gold are increasing in demand once again. A strong corrective phase took price action from its resistance zone into its support zone, but a recovery started to develop. This precious metal has now created a series of higher highs and higher lows which represents a bullish formation expected to inspire a technical breakout and allow gold to recover. You can read more about a breakout here.
The Force Index, a next-generation technical indicator, has recovered from its low which was set before gold moved into its support zone but remains at depressed levels. A negative divergence formed which led price action lower after reaching its descending 61.8 Fibonacci Retracement Fan Resistance Level. The Force Index descended below its horizontal resistance level which additionally took it below its ascending support level as marked by the green rectangle. While this technical indicator remains in negative territory with bears in charge, a recovery is anticipated to follow fundamental developments, and a breakout in the Force Index is likely to lead this price action higher.
Gold is currently located above its 50.0 Fibonacci Retracement Fan Support Level and below its 61.8 Fibonacci Retracement Fan Resistance Level. The breakout above its support zone, located between 1,445.42 and 1,456.01 as marked by the grey rectangle, has ended the corrective phase in this precious metal from a technical perspective while fundamental factors are adding bullish momentum. A breakout above the 61.8 Fibonacci Retracement Fan Resistance Level will eliminate the last hurdle for price action to accelerate into its resistance zone. You can learn more about the Fibonacci Retracement Fan here.
One key level to monitor is the intra-day high of 1,474.23 which represents the peak of the initial breakout in gold above its support zone. This was reversed by its 50.0 Fibonacci Retracement Fan Resistance Level, before it was converted to support, and pressured price action into the top range of its support zone before advancing to a higher high. A breakout above this mark is anticipated to initiate a short-covering rally which will provide the catalyst for an advance into its next resistance zone located between 1,507.95 and 1,517.69 as marked by the red rectangle.
Gold Technical Trading Set-Up - Breakout Extension Scenario
⦁ Long Entry @ 1,467.00
⦁ Take Profit @ 1,517.00
⦁ Stop Loss @ 1,452.50
⦁ Upside Potential: 5,000 pips
⦁ Downside Risk: 1,450 pips
⦁ Risk/Reward Ratio: 3.45
In case of more downside in the Force Index, assisted by its descending resistance level, gold may be pressured into a breakdown below its support zone and back into its 38.2 Fibonacci Retracement Fan Support Level. The next support zone awaits price action between 1,400.31 and 1,410.90 and any correction into this zone should be taken advantage of with buy orders; the long-term fundamental outlook favors significant more upside in gold.
Gold Technical Trading Set-Up - Limited Breakdown Scenario
⦁ Short Entry @ 1,436.00
⦁ Take Profit @ 1,405.00
⦁ Stop Loss @ 1,448.50
⦁ Downside Potential: 3,100 pips
⦁ Upside Risk: 1,250 pips
⦁ Risk/Reward Ratio: 2.48

