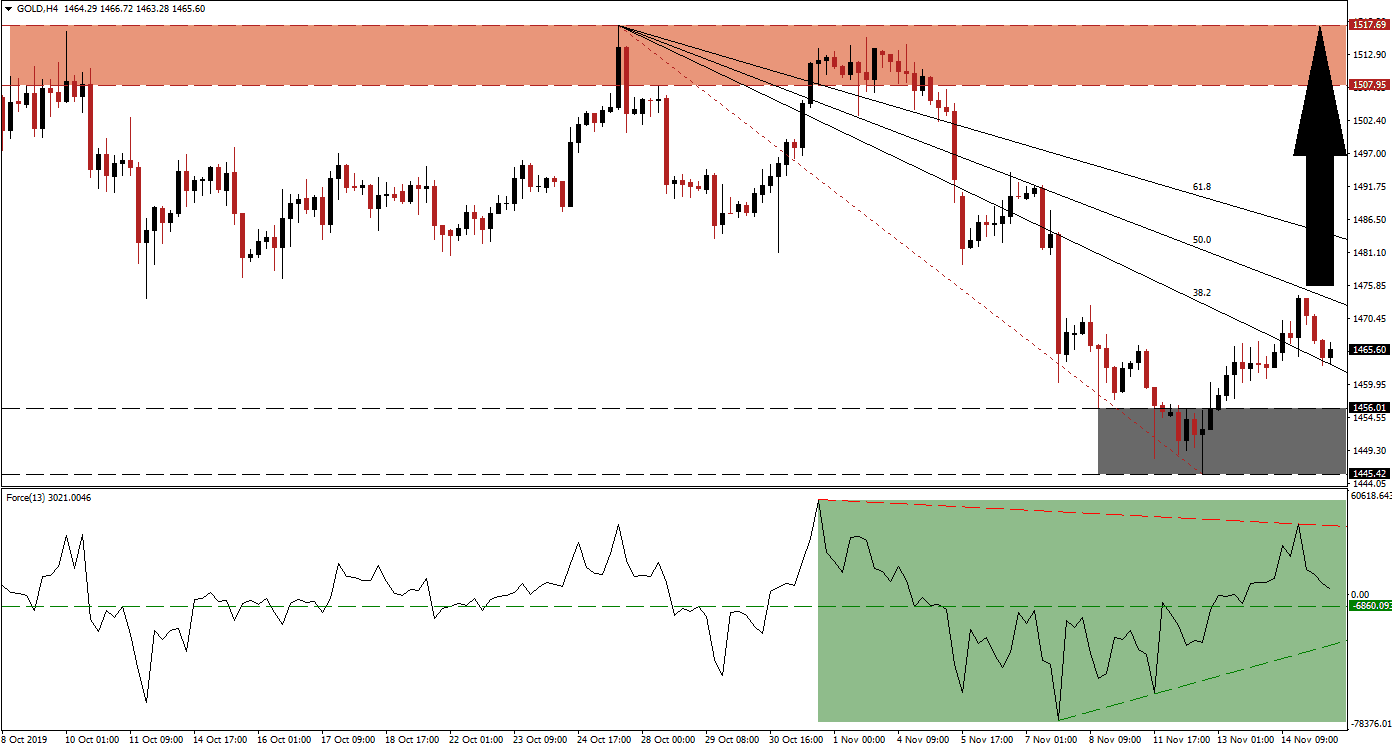
Gold has been under extreme selling pressure as traders rotated out of this safe-haven asset and moved into riskier ones. The global fundamental scenario favors more upside in this precious metal, supported by central bank buying. Following the violent contraction which took price action from its resistance zone into its support zone, a breakout has lifted gold back above its descending 38.2 Fibonacci Retracement Fan Resistance Level and turned it into support. The 50.0 Fibonacci Retracement Fan Resistance Level has rejected an extension of the breakout, but bullish momentum remains elevated. You can learn more about the Fibonacci Retracement Fan here.
The Force Index, a next-generation technical indicator, formed a positive divergence as gold approached its support zone and this bullish development led to a breakout. After this precious metal was rejected by its 50.0 Fibonacci Retracement Fan Resistance Level, bullish momentum decreased and the Force Index reversed. This is a normal development and as long as this technical indicator remains above its ascending support level, the uptrend remains intact. The Force Index maintains its position in positive territory which suggests that bulls remain in charge and more upside is expected.
With uncertainty on the rise in regards to global trade, growing unrest which is spreading across all continents and the increase in natural disasters often linked to global warming, the long-term prospects for gold remain bullish. The breakout above its support zone, located between 1,445.42 and 1,456.01 as marked by the grey rectangle is expected to lead to a bigger advance. A sustained breakout in price action above the 50.0 Fibonacci Retracement Fan Resistance Level may ignite a short-covering rally that will further push this precious metal towards its 2019 high. You can learn more about a support zone here.
Traders are now advised to monitor the intra-day high of 1,474.23 which marks the peak of the breakout in gold above its support zone. A move above this level will convert the 50.0 Fibonacci Retracement Fan Resistance Level into support and is likely to attract fresh net long positions in this precious metal. This would also prepare gold for a final breakout above its 61.8 Fibonacci Retracement Fan Resistance Level and clear the path into the next resistance zone, located between 1,507.95 and 1,517.69 as marked by the red rectangle. Volatility is expected to remain elevated as different fundamental events unfold.
Gold Technical Trading Set-Up - Breakout Extension Scenario
⦁ Long Entry @ 1,465.00
⦁ Take Profit @ 1,517.50
⦁ Stop Loss @ 1,452.00
⦁ Upside Potential: 5,250 pips
⦁ Downside Risk: 1,300 pips
⦁ Risk/Reward Ratio: 4.04
In case of an extended breakdown in the Force Index below its ascending support level, gold may follow suit with a breakdown attempt below its support zone. This remains an unlikely scenario given the fundamental conditions, but if price action pushes lower, the next support zone is located between 1,381.59 and 1,400.31 which marks an outstanding long-term buying opportunity.
Gold Technical Trading Set-Up - Limited Breakdown Scenario
⦁ Short Entry @ 1,435.00
⦁ Take Profit @ 1,400.00
⦁ Stop Loss @ 1,450.00
⦁ Downside Potential: 3,500 pips
⦁ Upside Risk: 1,500 pips
⦁ Risk/Reward Ratio: 2.33

