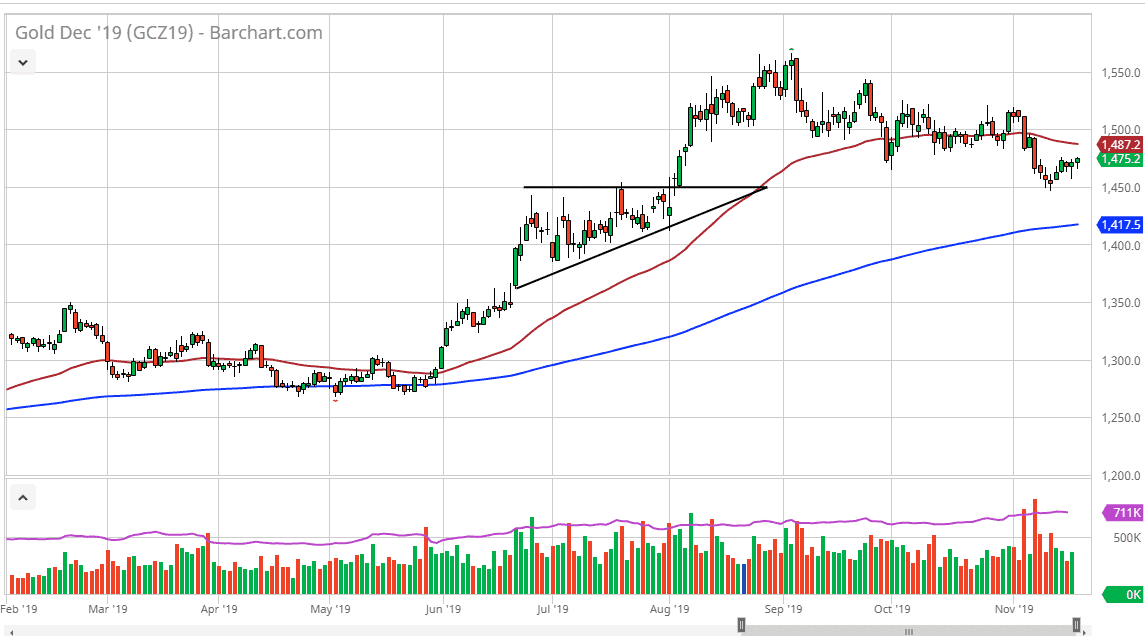
Gold markets have initially pulled back during the trading session on Tuesday but turned around to show signs of life yet again. Quite frankly, in this environment it makes quite a bit of sense that gold would continue to go higher, because quite frankly we never know what’s going to hit the newswires next. The US/China trade situation is in theory getting better, but we have yet to see any real substantial movement. Because of this, expect gold to continue to be one of the favorite vehicles to protect against headline risks and of course trade war issues. At this point in time it’s likely that we will see the area just below at the $1450 level offering significant support, as it was previous resistance.
As you can see on the chart, I have an ascending triangle drawn that had a top at $1450, so that is what I am basing most of my support on. What you don’t see is that the level is actually the 38.2% Fibonacci retracement level as well, so it’s likely that we will continue to see traders being interested in that area as well. After all, it was a very bullish run that we had in the gold market until the last couple of months, and while we have pulled back since the middle of September, it has been very slow and measured.
In other words, I believe that a lot of people are looking at this as an opportunity to pick up gold “on the cheap”, and they are digesting gains as well. Simply put, there hasn’t been a huge amount of selling entering the market, at least not yet and therefore it looks as if gold probably still has further to go to the upside. This isn’t to say that we get there right away, but I do recognize that the $1450 level was an area that had to hold support, and now that it has, it makes sense as we should continue to see a lot of value hunters out there. After all, it’s obvious that there was a huge move to the upside and gold and everybody in the world knows that the central banks around the world are loose to say the least, so that should in fact help the idea of gold going higher longer-term as fiat currencies “race to the bottom. Looking at this chart, there is also a significant amount of support in the form of the 200 day EMA underneath at the $1417 level. That would be your trend defining indicator.

