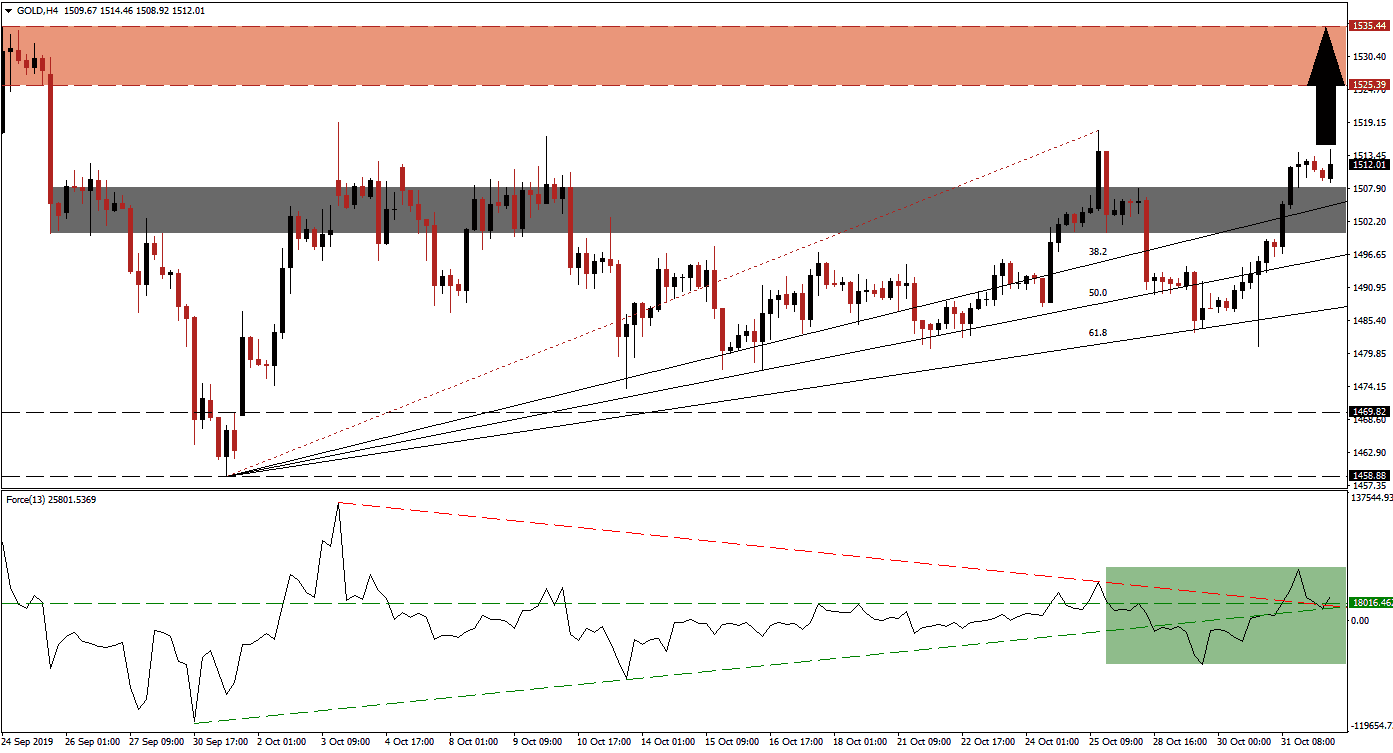
Third-quarter earnings season has been solid, but the global economy continues to slow down with manufacturing in most regions already in a recession. While gold has been stuck in a sideways trading range as a result of mixed economic signals, the general bias has been bearish with a negative outlook. Central bank gold buying has further placed a floor under this precious metal and with trade negotiations between the US and China apparently at yet another impasse, more upside should be expected. Volatility returned, but the re-drawn Fibonacci Retracement Fan sequence has supported gold and is expected to increase upside pressure on price action. You can read more about the Fibonacci Retracement Fan here.
The Force Index, a next generation technical indicator, indicates the formation of a positive divergence as gold has confirmed its short-term support zone following the conversion from resistance. Another bullish development emerged when the Force Index advanced from its ascending support level which also elevated it above its descending resistance level and turned its horizontal resistance level back into support; this is marked by the green rectangle. With the Force Index in positive territory, and bulls in control of price action, gold is expected to extend it move to the upside.
Fundamental factors which suggest a further increase in price action are now supported by technical factors and bullish momentum is expanding following the breakout above its short-term support zone; this zone is located between 1,500.27 and 1,508.01 as marked by the grey rectangle. The ascending 38.2 Fibonacci Retracement Fan Support Level is nestled inside this zone with the 50.0 Fibonacci Retracement Fan Support Level approaching; a move by this level above the key psychological 1,500 mark is further expected to provide a boost to the upside in gold. You can read more about a breakout here.
Following the conversion of the short-term resistance zone into support, through a breakout above it, the path is clear for gold to extend into its next long-term resistance zone which is located between 1,525.39 and 1,535.44 as marked by the red rectangle. Traders should monitor the intra-day high of 1,517.69 which represents the peak of the breakout as well as the end point of the re-drawn Fibonacci Retracement Fan sequence; a move higher is expected to propel price action into is resistance zone from where more upside is possible.
Gold Technical Trading Set-Up - Breakout Extension Scenario
- Long Entry @ 1,512.50
- Take Profit @ 1,535.40
- Stop Loss @ 1,505.65
- Upside Potential: 2,290 pips
- Downside Risk: 685 pips
- Risk/Reward Ratio: 3.34
Should the Force Index complete a triple breakdown, below its horizontal support level as well as below its ascending support level and descending resistance level which acts as temporary support, gold is likely to follow with a breakdown its short-term support zone. Given the current fundamental scenario, downside potential is expected to be limited to its ascending 61.8 Fibonacci Retracement Fan Support Level; this will result in a higher low and keep the long-term uptrend intact. A breakdown into its long-term support zone, located between 1,458.88 and 1,469.82 remains an unlikely possibility and would require a major fundamental catalyst. In case gold does extend into this zone, it should be considered an excellent long-term buying opportunity.
Gold Technical Trading Set-Up - Limited Breakdown Scenario
- Short Entry @ 1,497.50
- Take Profit @ 1,487.00
- Stop Loss @ 1,502.75
- Downside Potential: 1,050 pips
- Upside Risk: 525 pips
- Risk/Reward Ratio: 2.00

