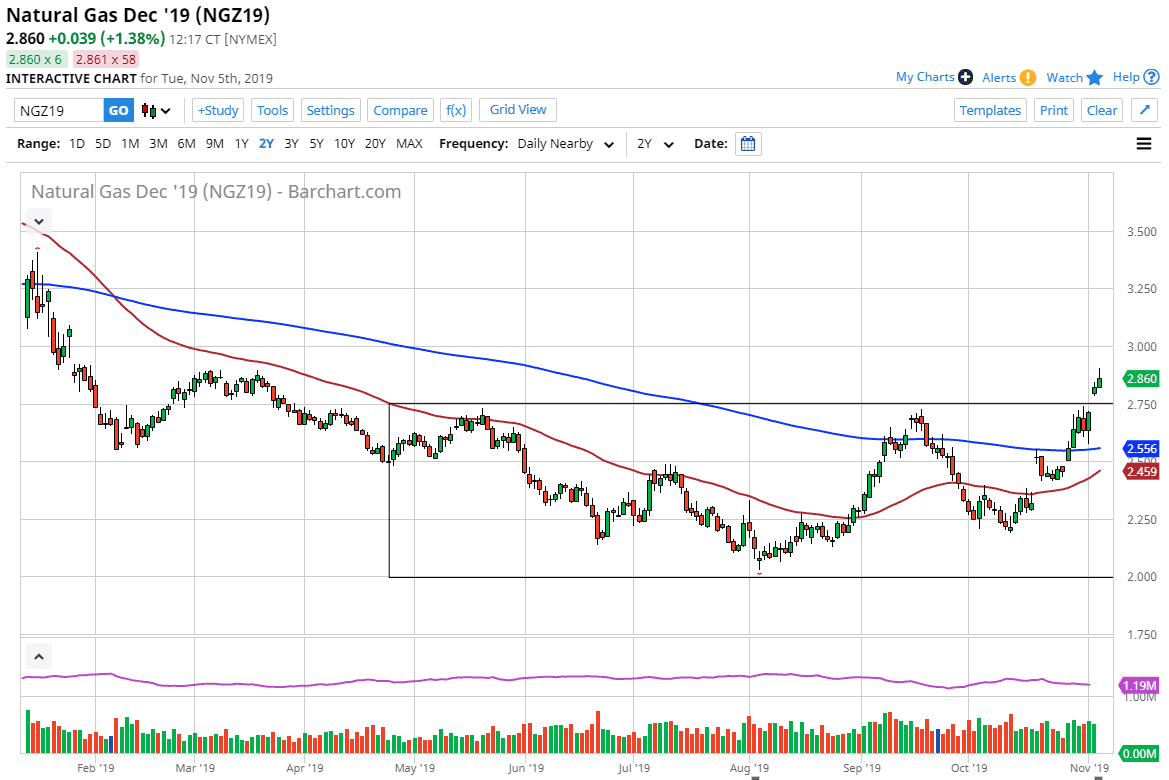
The natural gas markets continue to see a lot of bullish pressure as the market had reached as high as $2.90, but at this point looks very likely that a pullback could be coming. The only reason I say this is that the inventory figure is coming rather shortly, I think at this point it’s likely that the market pulling back will only offer value that we can take advantage of. The gap underneath would be a nice opportunity to find plenty of bullish pressure to go long.
Looking at the chart, the most logical place that the buyers will try to reach is the $3.00 level, an area that has a lot of psychological importance attached to it. Because of this, I suspect it’s only a matter of time before the sellers would return there, only to cause a little bit more of a pullback that you can take advantage of again. All things being equal, this is a market that is going to continue to grind higher due to the colder temperatures hitting the United States, and therefore a significant amount of demand coming into the market.
The 200 day EMA is below the most recent cluster of trading, so it should offer plenty of support. Ultimately, the market will tend to run until about the middle of January, when the futures market will start to focus on the spring contracts. At this point, short-term pullback should be thought of as opportunity, and probably will be for the next couple of months. This is a cyclical trade that does quite well over the longer term, so at this point it makes quite a bit of sense to simply follow it. As temperatures plunges in places like Boston or New York, it’s likely that demand will continue to pick up, and therefore drive the price of this commodity much higher.
Considering just how strong the US dollar was during the trading session on Tuesday, it’s quite remarkable that we still drove as high as we did during the trading session. Look at pullbacks as your buying opportunity, and at this point I have no interest whatsoever in trying to short this market. As we have made a “higher high”, and even done so on a gap higher, this is an extraordinarily bullish sign as beyond everything mentioned in this article, it looks like we are getting ready to form the “golden cross”, when the 50 day EMA crosses above the 200 day EMA.

