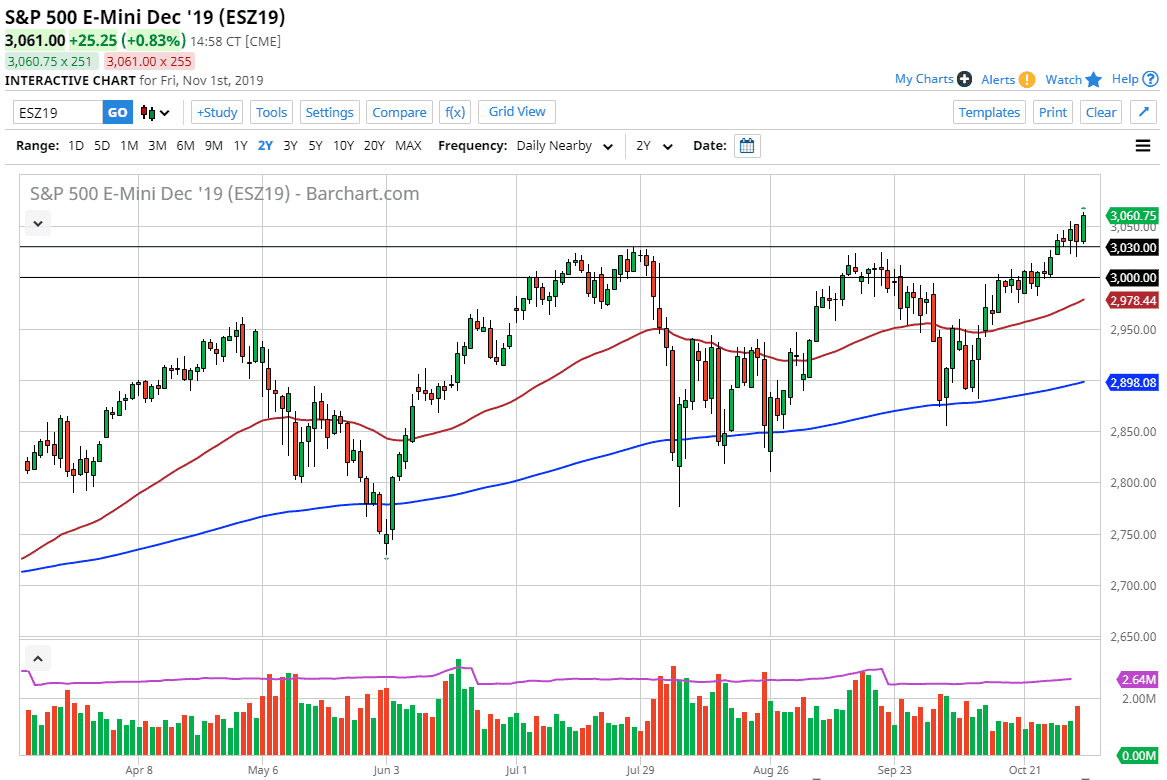
The S&P 500 rallied significantly during the trading session on Friday, breaking above the 3050 level in a sign of extreme strength. That being the case, the market is very likely to continue going higher, based upon the fact that we close that the very top of the candlestick, showing signs that it’s very likely continuation would more than likely be the norm. At this point, I think that the jobs number coming out much stronger than anticipated has sent this market much higher. Ultimately, the market should then go looking toward support at the 3030 level. This is an area that should be massive support based upon the candlestick action over the last couple of days, and I believe that it extends down to the 3000 level.
There is a lot of psychological importance attached to the 3000 handle, but it is also an area where we’ve seen a lot of selling pressure previously anyway. This means that the market is likely to go forward and looking at this market area as a potential “floor” in the market. At this point, the area should be thought of as a binary switch so to speak, meaning that if we break down below it certainly would be a very negative situation. On the other hand, as long as we can see above there it’s very likely that we will continue to go much higher.
The longer-term chart has formed a bit of an ascending triangle, and at this point it’s very likely that we should continue to go higher. The ascending triangle measures for a move to 3200, and on this chart there’s really nothing to suggest that we are going to get there. Granted, there’s always the US/China situation that could blow up at any moment, but barring some type of headline like that, I suspect that the market will continue to go higher. The Federal Reserve looks likely to back the market, and even though they are on the sidelines and waiting to see the data before loosening monetary policy any further, the market is pretty sure that the Federal Reserve is going to continue to protect the market. At this point, dips should continue to offer plenty of buying opportunities, so looking at shorter-term charts might be the way to go but keep an eye on the daily timeframe and the daily supporting resistance levels should continue to guide your decisions.

