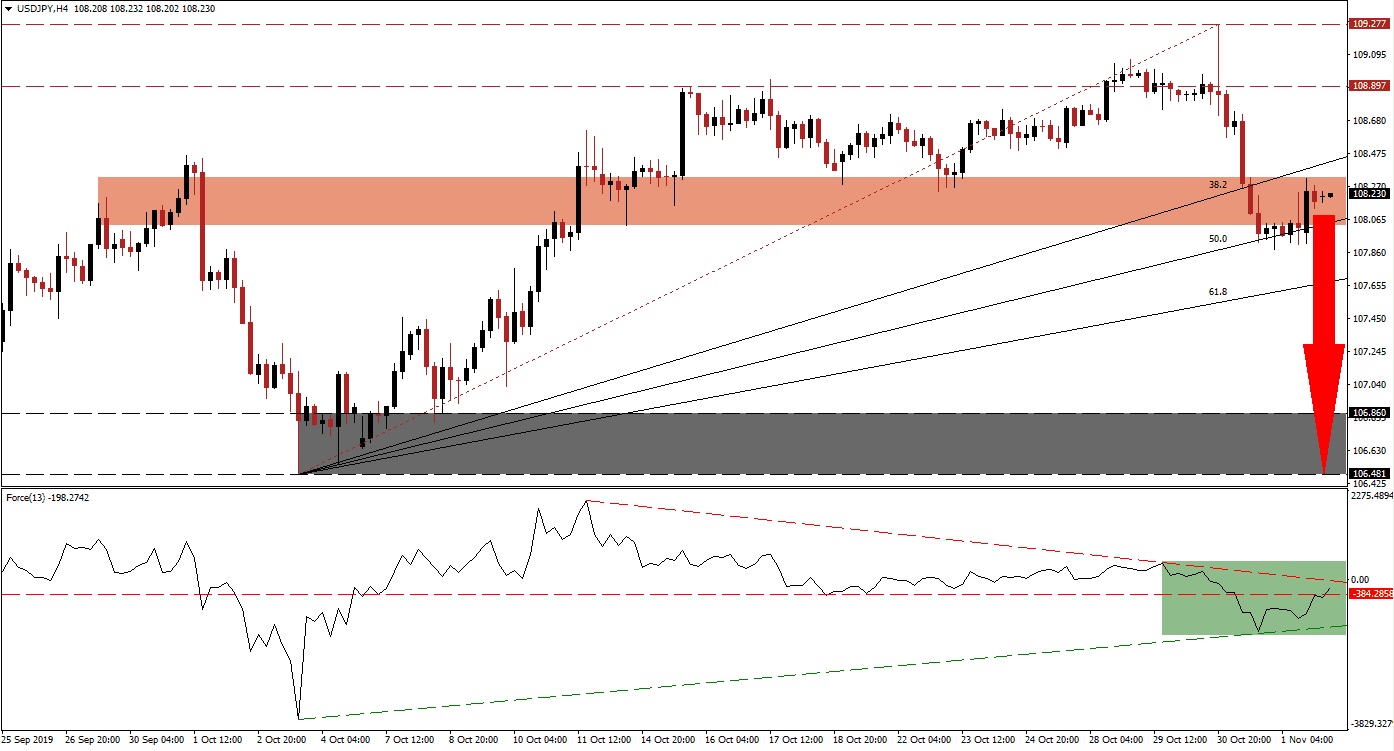
16 Asian countries are close to signing an ASEAN trade pact which will be the largest in the world; this comes on the back of the US-China trade war expected to remain part of the global economy for years to come and offered a fresh sign that investors should prepare for change rather than collapse. India is the only country who currently holds up progress as New Delhi issued fresh demands and could be left out of the trade pact, but overall the mood was positive. The USD/JPY remained inside its short-term resistance zone from where bearish momentum is on the rise and a breakdown appears likely; the Fibonacci Retracement Fan sequence is crossing trough this zone and has increased pressures on price action.
The Force Index, a next generation technical indicator, confirmed the pause in the breakdown of the USD/JPY as it started to drift higher following a move by this currency pair into its 50.0 Fibonacci Retracement Fan Support Level. As the Force Index started to drift higher, an ascending support level emerged and pushed this technical indicator above its horizontal resistance level; the descending resistance level is adding downside pressure, as marked by the green rectangle, and expected to push for a reversal. This technical indicator also remains in negative territory which indicates that bears remain in control of price action. You can learn more about the Force Index here.
Price action paused its breakdown, which started after this currency pair completed a move below its long-term resistance zone located between 108.897 and 109.277. The USD/JPY pushed below its short-term support zone and turned it into resistance, after which the 50.0 Fibonacci Retracement Fan Support Level allowed for a drift higher and test of its new short-term resistance zone. This zone is located between 108.031 and 108.326 as marked by the red rectangle; the ascending 38.2 Fibonacci Retracement Fan Resistance Level already crossed above this zone while the 50.0 Fibonacci Retracement Fan Support Level just entered it.
While this currency pair may attempt a move into its 38.2 Fibonacci Retracement Fan Resistance Level, located just above its short-term resistance zone, the slow rise in bearish momentum suggests that an extension of the breakdown sequence is likely. Forex traders should monitor the Force Index together with the intra-day high of 108.326 which marks the current peak of the pause as well as the top range of its short-term resistance zone; new net sell orders are likely as the USD/JPY will test the strength of resistance. A breakdown is expected to follow which will resume the long-term downtrend and take price action through its Fibonacci Retracement Fan sequence and back into its long-term support zone; this zone is located between 106.481 and 106.860 as marked by the grey rectangle.
USD/JPY Technical Trading Set-Up - Breakdown Extension Scenario
Short Entry @ 108.250
Take Profit @ 106.650
Stop Loss @ 108.600
Downside Potential: 160 pips
Upside Risk: 35 pips
Risk/Reward Ratio: 4.57
A push higher in the USD/JPY, confirmed by a breakout in the Force Index above its descending resistance level, could reverse the breakout in this currency pair. Upside potential following a breakout is expected to remain limited to its long-term resistance zone as fundamental factors favor more downside; a breakout above its short-term resistance zone should be considered as a solid short-selling opportunity.
USD/JPY Technical Trading Set-Up - Limited Breakout Scenario
Long Entry @ 108.750
Take Profit @ 109.050
Stop Loss @ 108.600
Upside Potential: 30 pips
Downside Risk: 15 pips
Risk/Reward Ratio: 2.00

