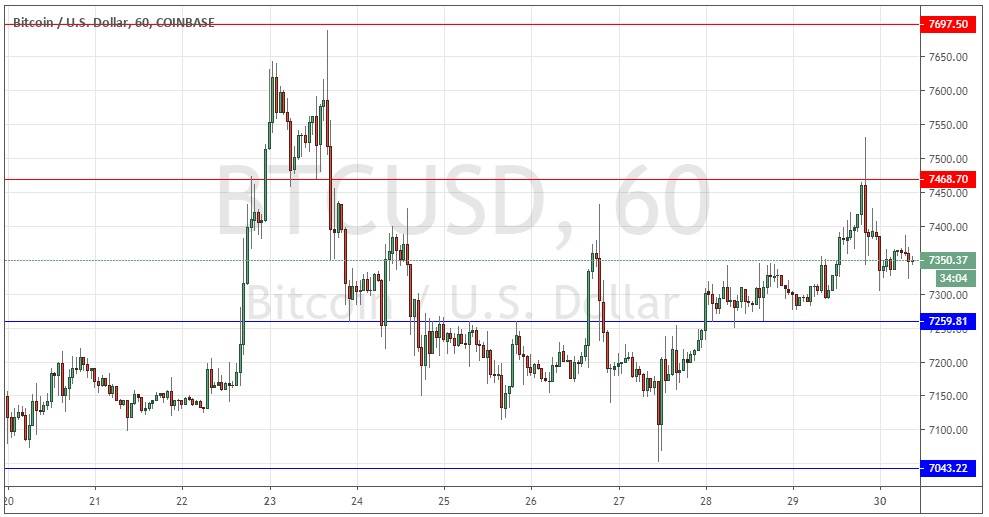
Bitcoin: Bearish head & shoulders would complete below $7,000
Last Thursday’s signals were not triggered as there was no bearish price action at $7,260 and bearish price action that did reverse was a little too high for the other level given.
Today’s BTC/USD Signals
Risk 0.75% per trade.
Trades must be entered prior to 5pm Tokyo time Tuesday.
Long Trade Idea
Go long after a bullish price action reversal on the H1 time frame following the next touch of $7,260 or $7,043.
Place the stop loss 1 pip below the local swing low.
Move the stop loss to break even once the trade is $50 in profit by price.
Remove 50% of the position as profit when the trade is $50 in profit by price and leave the remainder of the position to run.
Short Trade Ideas
Go short after a bearish price action reversal on the H1 time frame following the next touch of $7,469 or $7,698.
Place the stop loss 1 pip above the local swing high.
Move the stop loss to break even once the trade is $50 in profit by price.
Remove 50% of the position as profit when the trade is $50 in profit by price and leave the remainder of the position to run.
The best method to identify a classic “price action reversal” is for an hourly candle to close, such as a pin bar, a doji, an outside or even just an engulfing candle with a higher close. You can exploit these levels or zones by watching the price action that occurs at the given levels.
BTC/USD Analysis
I wrote last Thursday that the key pivotal point seemed to be resistance at $7,260. Yet even if the price can get established above that level and rise as far as $7,456 it would seem to only be completing the final hump of a bearish head and shoulders pattern indicating another downwards move would be imminent. Therefore, I was keen to look for a short trade from any of the nearby resistance levels.
I had thought that the resistance at $7,456 looked like a very ripe opportunity and so it has eventually become. Yet the price is not obviously readying itself to move lower, in fact, bulls and bears seem very evenly matched and it looks like the price will be prone to range between $7,043 and $7,698. Nevertheless, the bearish head and shoulders pattern remains valid and prone to complete, so a break below the support at $7,043 and also the round number confluent with it at $7,000 would be a bearish sign and I would take a bearish bias if it happened. Conversely, if the price could get established above $7,700 it would invalidate the bearish head and shoulders pattern completely and so would be a bullish sign. Concerning the USD, there will be a release of Chicago PMI data at 2:45pm London time.
