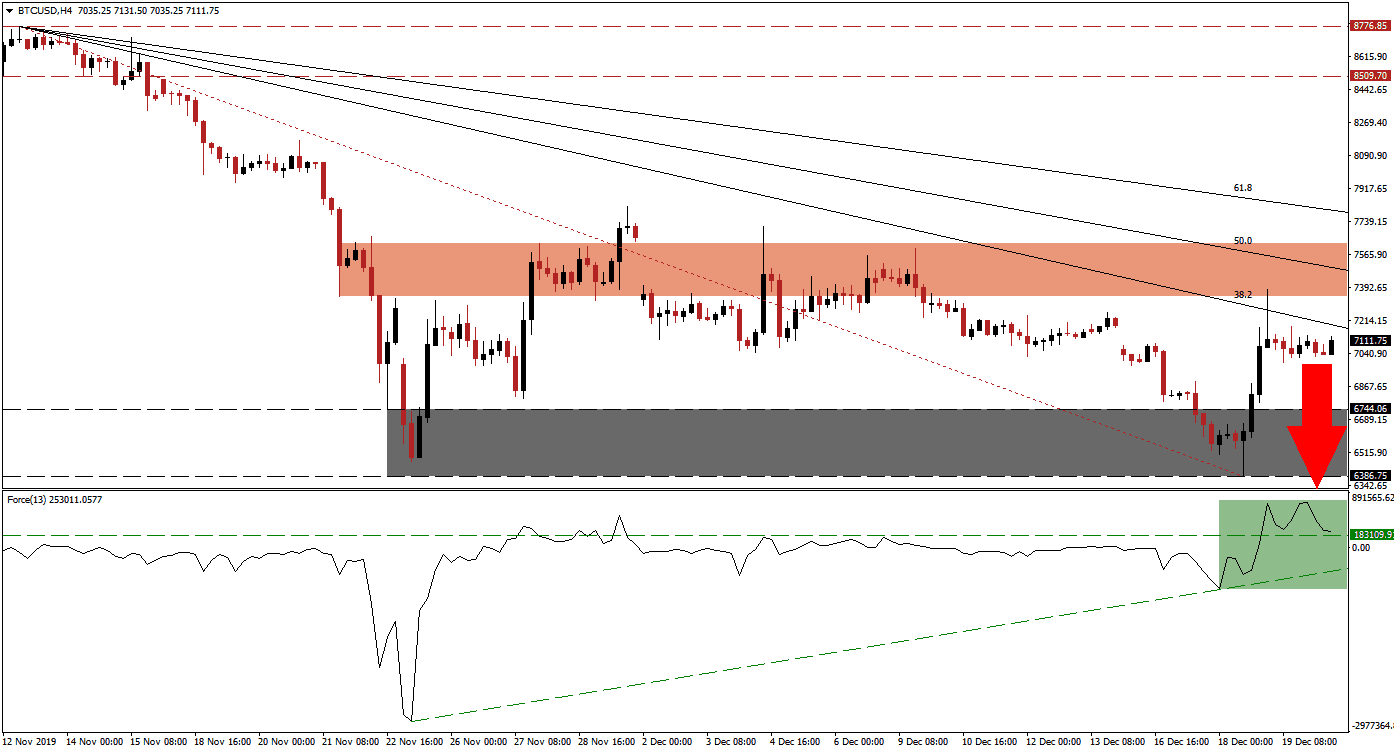
Bitcoin is in recovery mode after dropping below 6,400, but the bearish trend remains intact, and more downside is expected to follow. The bounce higher and above its support zone can be attributed to a short-covering rally and created a bull trap. Bitcoin’s fundamental outlook for value storage remains bright, but as a remittance tool, it is expected to further lose application and functionality. Miners are eager to put 2019 behind them and close the book on the worst year since 2014. Volatility in the BTC/USD is anticipated to remain elevated, as institutional traders conduct year-end portfolio adjustments.
The Force Index, a next-generation technical indicator, pushed to a fresh high as this cryptocurrency pair entered a 10%+ recovery. Bullish momentum failed to extend its gains and reversed as the BTC/USD was rejected by its short-term resistance zone. The Force Index remains above its horizontal support level, as marked by the green rectangle, but a breakdown is expected to follow. This technical indicator is favored to descend into its newly formed ascending support level, which will place it in negative territory, and bears in control of price action. You can learn more about the Force Index here.
Price action briefly pierced its descending 38.2 Fibonacci Retracement Fan Resistance Level to the upside but was unable to maintain the breakout. The short-term resistance zone located between 7,344.45 and 7,623.00, as marked by the red rectangle, rejected an extension of the breakout and sustained the long-term downtrend. More downside pressure is provided by the Fibonacci Retracement Fan sequence, likely to result in a renewed drop below the 7,000 mark. The price of the BTC/USD remains below mining profitability, which adds to short-term bearish developments.
2020 will feature the next having event, at which point more miners may capitulate as rewards are cut by 50%. For small miners to remain in the network, sustained price action recovery is necessary. The network already suffers from centralization issues. Despite the bullish long-term outlook for the BTC/USD, more downside is favored to precede a potential recovery in this cryptocurrency pair. Price action is likely to complete a breakdown below its support zone located between 6,386.75 and 6,744.06, as marked by the grey rectangle. This would clear the path for an extension of the sell-off into its next support zone, located between 5,592.01 and 5,920.29.
BTC/USD Technical Trading Set-Up - Breakdown Scenario
Short Entry @ 7,100.00
Take Profit @ 5,600.00
Stop Loss @ 7,460.00
Downside Potential: 150,000 pips
Upside Risk: 36,000 pips
Risk/Reward Ratio: 4.17
In case of a fresh attempt in the Force Index to add to its advance, the BTC/USD may be pressured into more upside. Due to the short-term fundamental developments, supported by the technical scenario, the upside potential remains limited to its short-term resistance zone. The 50.0 Fibonacci Retracement Fan Resistance Level is expected to keep the downtrend alive, and any recovery from current levels should be viewed as a solid short-selling opportunity.
BTC/USD Technical Trading Set-Up - Limited Breakout Extension Scenario
Long Entry @ 7,650.00
Take Profit @ 8,000.00
Stop Loss @ 7,500.00
Upside Potential: 35,000 pips
Downside Risk: 15,000 pips
Risk/Reward Ratio: 2.33

