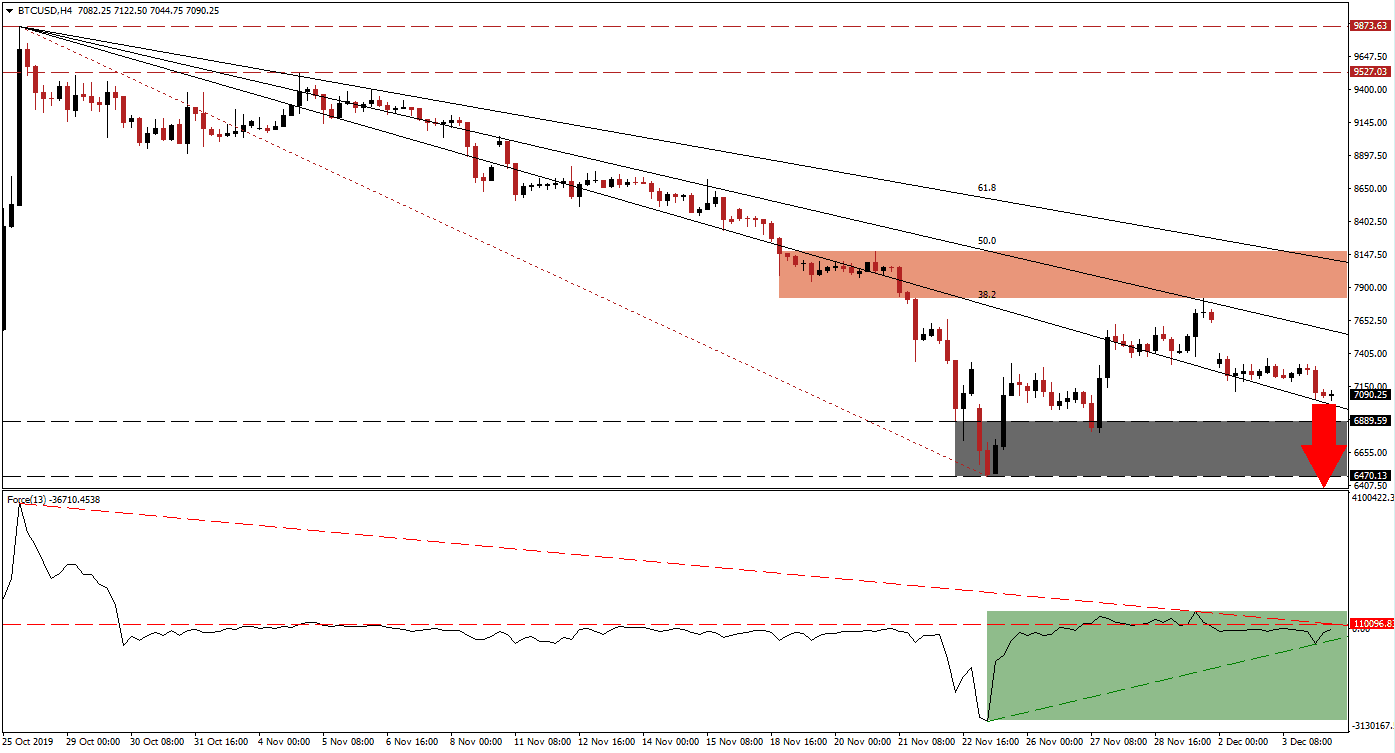
Bitcoin continues to struggle and the overall bearish environment remains in place. With the BTC/USD once again looking down at the $7,000 mark, a breakdown presents the path of least resistance. The end-of-October price spike that resulted in the 4th best daily performance in this cryptocurrency pair, on the back of misinterpreted comments from Chinese President Xi, has been reversed. Year-end portfolio adjustments are additionally expected to increase volatility and risk a breakdown below its support zone. You can learn more about a breakdown here.
The Force Index, a next-generation technical indicator, recovered from its low that accompanied price action into its support zone. The Force Index is currently trapped between its ascending support level and its descending resistance level, below its horizontal resistance level as marked by the green rectangle. Bears remain in control of price action as this technical indicator remains deep in negative territory and the double resistance level may pressure the Force Index below its ascending support level, leading to more downside in the BTC/USD.
After price action reversed from its support zone, this cryptocurrency pair was rejected by its descending 50.0 Fibonacci Retracement Fan Resistance Level; the intra-day high of the breakout sequence formed the bottom range of the resistance zone located between 7,819.00 and 8,170.50 as marked by the red rectangle. The BTC/USD is now drifting to the downside in a price channel formed by its 50.0 Fibonacci Retracement Fan Resistance Level and its 38.2 Fibonacci Retracement Fan Support Level. You can learn more about the Fibonacci Retracement Fan here.
Forex traders are recommended to monitor the Force Index as a breakdown below its ascending support level or a breakout above its descending resistance level is expected to lead price action into its next move. The support zone located between 6,470.13 and 6,889.59 as marked by the grey rectangle reversed the preceding sell-off and includes a price gap to the upside, but the bearish trend has intensified since then and breakdown pressures are on the rise. The BTC/USD will face its next support zone between 5,920.29 and 5,592.01 and while retail demand remains solid, institutional activity trumps the retail sector.
BTC/USD Technical Trading Set-Up - Breakdown Scenario
Short Entry @ 7,100.00
Take Profit @ 5,750.00
Stop Loss @ 7,400.00
Downside Potential: 135,000 pips
Upside Risk: 30,000 pips
Risk/Reward Ratio: 4.50
In case of a breakout in the Force Index above its descending resistance level, the BTC/USD could attempt a recovery on the back of a short-covering rally. Given the existing fundamental outlook and short-term technical developments, upside potential is limited to its short-term resistance zone, enforced by the descending 61.8 Fibonacci Retracement Fan Resistance Level.
BTC/USD Technical Trading Set-Up - Price Action Reversal Scenario
Long Entry @ 7,600.00
Take Profit @ 8,100.00
Stop Loss @ 7,400.00
Upside Potential: 50,000 pips
Downside Risk: 20,000 pips
Risk/Reward Ratio: 2.50

