Yesterday’s PMI data out of the Eurozone showed the recession in the manufacturing as well as services sectors accelerated. US PMI data showed a pick-up in the services sector, but the combination was not enough to move the EUR/USD. Traders continue to await details regarding the disappointing phase-one trade deal between the US and China, which is considered a political necessity rather than a resolution to the trade deal; traders should view it more of an armistice. China remains quiet about details and doesn’t confirm US claims. A breakout attempt in this currency pair may emerge once more clarity is provided.
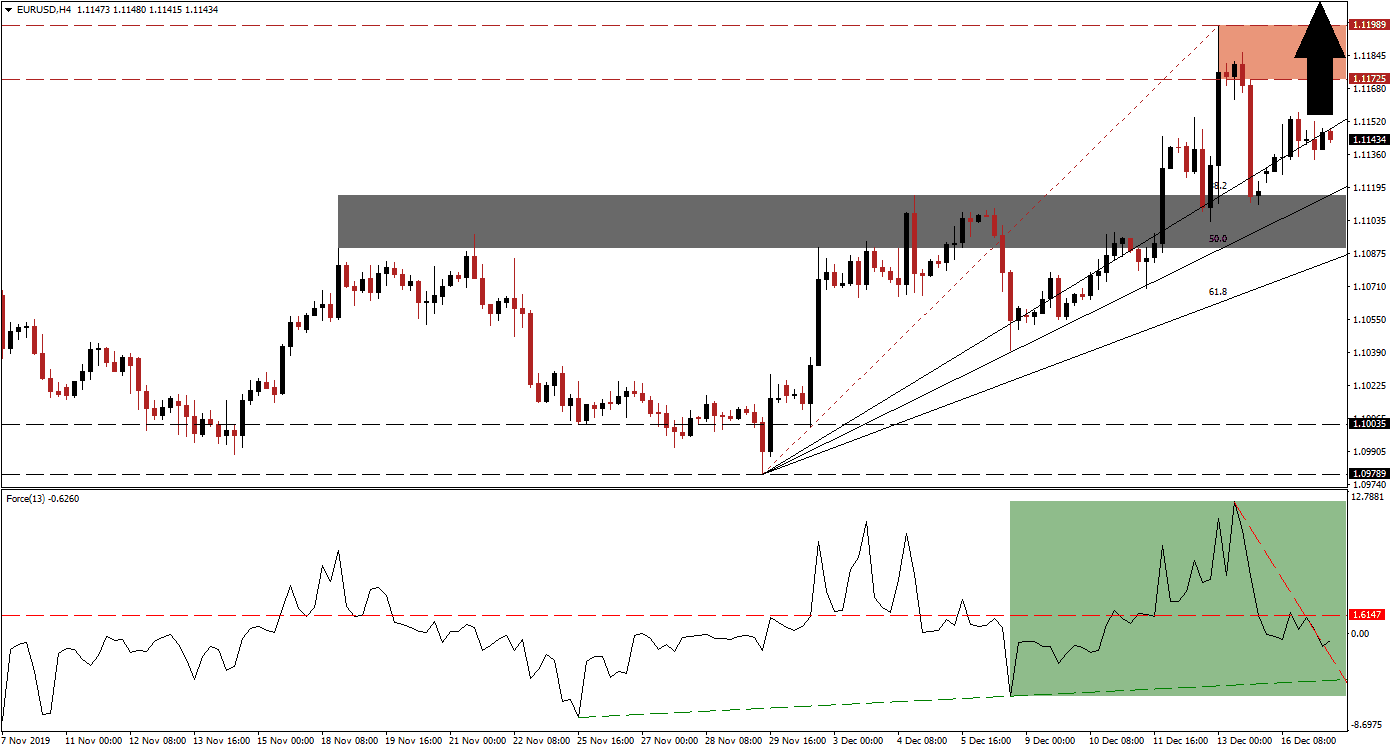
The Force Index, a next-generation technical indicator, confirms the temporary deflation of bullish pressures after it dropped from a new high below it its horizontal support level; this converted it back into resistance. A steep descending resistance level emerged as a result of the sharp reversal, but the Force Index is pushing above it, as marked by the green rectangle. While this technical indicator descended into negative territory, suggesting bears are in charge of the EUR/USD, as long as it remains above its ascending support level the uptrend remains intact. You can learn more about the Force Index here.
Price action remains additionally supported by the ascending Fibonacci Retracement Fan sequence, which is likely to pressure this currency pair farther to the upside. The breakout in the EUR/USD above its short-term resistance zone converted it into support; this zone is located between 1.10897 and 1.11158, as marked by the grey rectangle, and opened the possibility for a bigger advance. The 38.2 and the 50.0 Fibonacci Retracement Fan Support Levels have already eclipsed this support zone.
While a minor pause in the advance is likely and price action may descend into its 50.0 Fibonacci Retracement Fan Support Level, a resumption of the advance is favored. The EUR/USD will face its first resistance zone between 1.11725 and 1.11989, as marked by the red rectangle. A push above the intra-day high of 1.11858, the peak before the breakdown located inside its resistance zone, is anticipated to allow for a breakout to materialize. The next resistance zone awaits this currency pair between 1.12855 and 1.13163.
EUR/USD Technical Trading Set-Up - Breakout Extension Scenario
Long Entry @ 1.11400
Take Profit @ 1.13150
Stop Loss @ 1.10900
Upside Potential: 175 pips
Downside Risk: 50 pips
Risk/Reward Ratio: 3.50
Should the Force Index extend its contraction and complete a breakdown below its ascending support level, the EUR/USD is expected to follow in kind. This will additionally take price action below its Fibonacci Retracement Fan Support Level from where a move into its long-term support zone located between 1.09789 and 1.10035 is likely; forex traders are advised to consider this an excellent buying opportunity.
EUR/USD Technical Trading Set-Up - Limited Breakdown Scenario
Short Entry @ 1.10600
Take Profit @ 1.10000
Stop Loss @ 1.10900
Downside Potential: 60 pips
Upside Risk: 30 pips
Risk/Reward Ratio: 2.00


