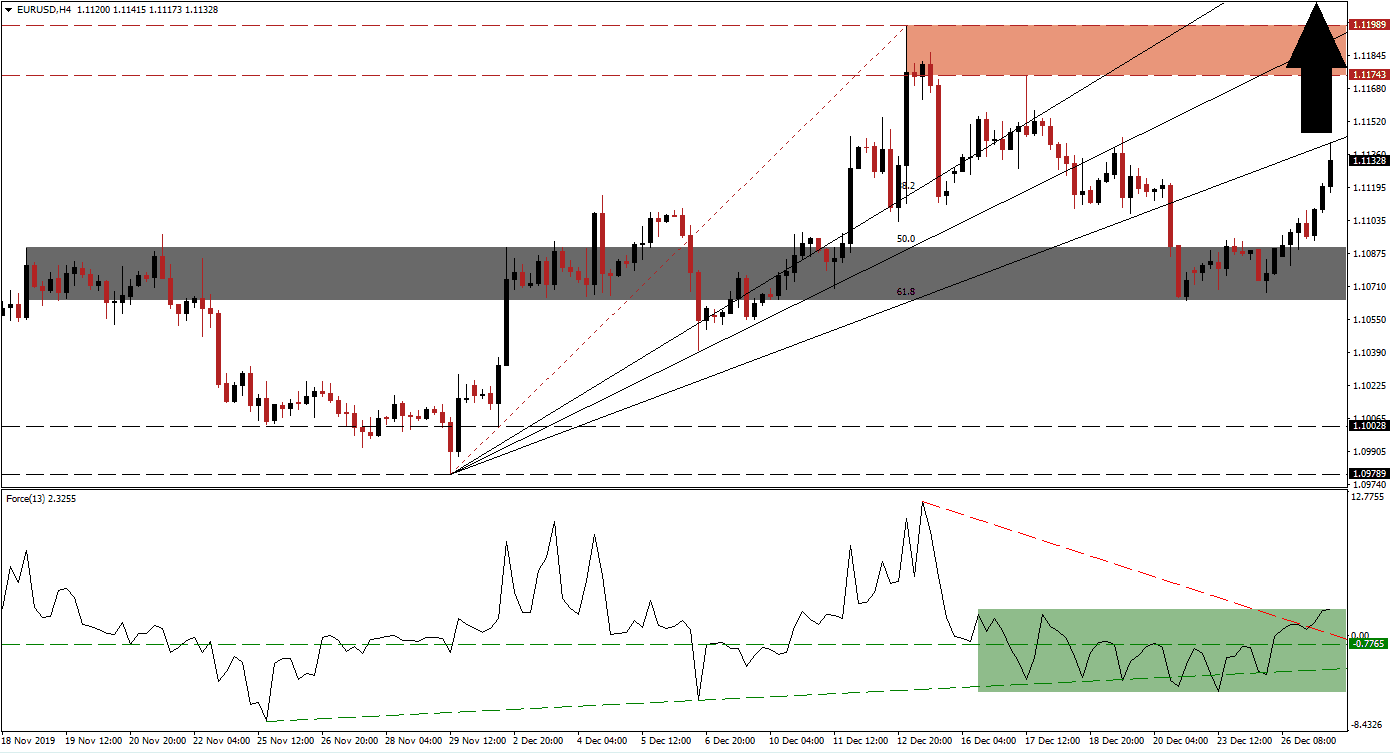
US Dollar weakness is accelerating, and the trend is anticipated to gain more momentum in 2020. The global economy is slowing down, with the US economy forecasted to underperform next year. While the Eurozone economy is mired in similar economic issues, capital outflows from the US Dollar are initially directed at the Euro. The US Federal Reserve has conducted a series of capital injections into its interbank lending market, raising concerns about stability. The EUR/USD was able to utilize thin trading volume and accelerate out of its short-term support zone.
The Force Index, a next-generation technical indicator, suggests more upside with bullish momentum expanding. Before the breakout, a series of lower lows accompanied the rejection of the EUR/USD by its resistance zone. The Force Index then surged after retaking its ascending support level, and momentum sufficed to convert its horizontal resistance level into support. This technical indicator additionally moved above its descending resistance level and into positive conditions, as marked by the green rectangle. Bulls are now in control and favored to extend the breakout sequence.
Following the breakout in the EUR/USD above its short-term support zone located between 1.10643 and 1.10904, as marked by the grey rectangle, the gap to its ascending 61.8 Fibonacci Retracement Fan Resistance Level was closed. It also paused the advance, a natural price action pattern, from where a renewed breakout attempt is favored to emerge. Bullish momentum remains strong while fundamental developments out of the US raise red flags about the health of its economy. You can learn more about the Fibonacci Retracement Fan here.
Price action should reach its resistance zone located between 1.11743 and 1.11989, as marked by the red rectangle. The 50.0 Fibonacci Retracement Fan Resistance Level is on the verge of crossing above this zone and may attract the EUR/USD to a breakout, extending the upside potential. The next resistance zone awaits this currency pair between 1.12855 and 1.13209, from where a fresh catalyst would be required to keep the rally intact. With the US and the Eurozone economies on track for a challenging 2020, the breakout sequence is expected to continue a rocky advance on the back of asset reallocations.
EUR/USD Technical Trading Set-Up - Breakout Extension Scenario
Long Entry @ 1.11350
Take Profit @ 1.13200
Stop Loss @ 1.10850
Upside Potential: 185 pips
Downside Risk: 50 pips
Risk/Reward Ratio: 3.70
Should the Force Index complete a breakdown below its ascending support level, the EUR/USD is anticipated to follow with a breakdown of its own. Due to the current fundamental outlook, confirmed by the technical scenario, the downside is likely to remain limited to its long-term support zone located between 1.09789 and 1.10028. This would equal a sound long-term buying opportunity for this currency pair.
EUR/USD Technical Trading Set-Up - Limited Breakdown Scenario
Short Entry @ 1.10550
Take Profit @ 1.09900
Stop Loss @ 1.10850
Downside Potential: 65 pips
Upside Risk: 30 pips
Risk/Reward Ratio: 2.17


