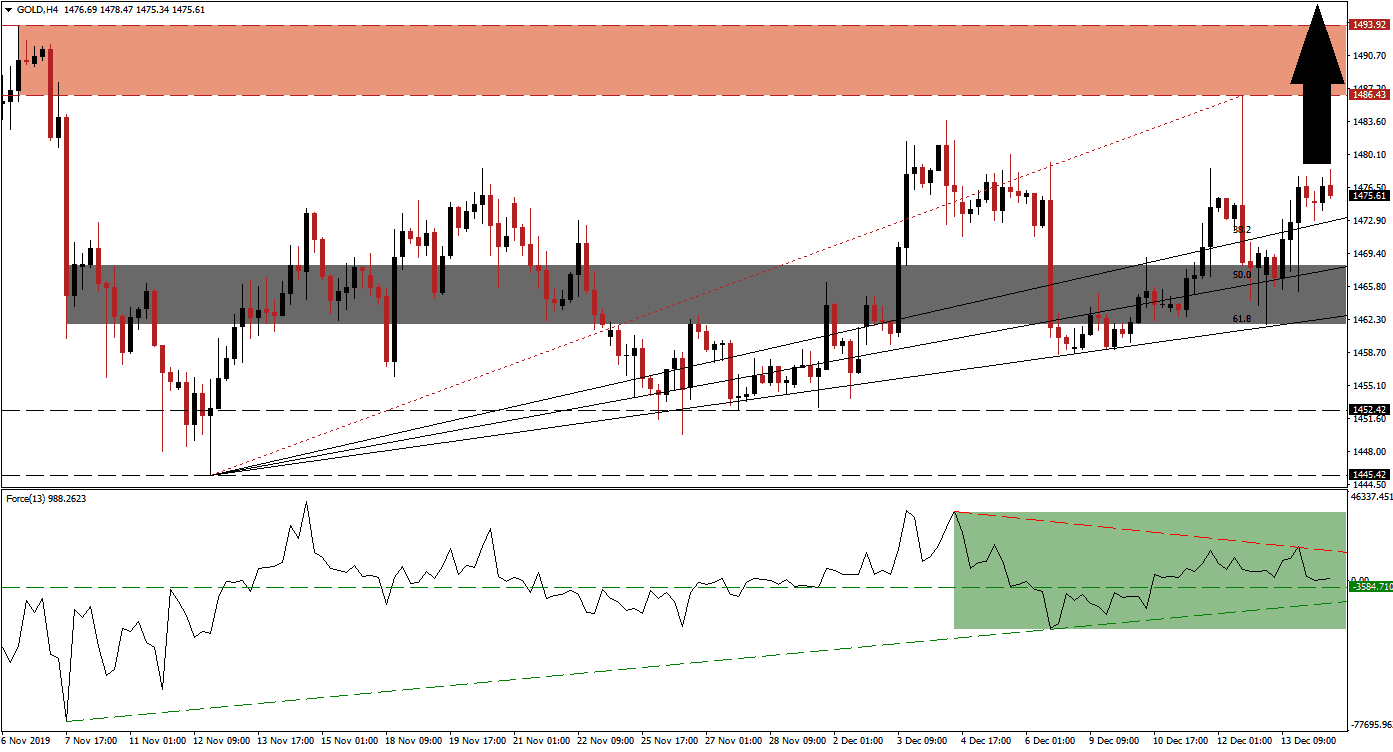
Safe-haven assets like gold are in demand as portfolio managers make year-end adjustments to their positions. The phase-one US-China trade deal represented a disappointment and contributed nothing to avert the ongoing global economic slowdown. After this precious metal corrected into its long-term support zone, a bullish chart pattern emerged through a series of higher highs and higher lows. More upside and a fresh breakout are anticipated to follow, allowing price action to extend its advance.
The Force Index, a next-generation technical indicator, points towards solid bullish momentum for gold. The recovery off of the ascending support level in the Force Index carried it above its horizontal resistance level, converting it into support. This technical indicator was rejected by its descending resistance level, as marked by the green rectangle, but remains in positive conditions with bulls in control. A renewed push higher is favored, leading this precious metal father to the upside. You can learn more about the Force Index here.
Price action converted its short-term resistance zone back into support, as a result of the bullish recovery in gold. This zone is located between 1,461.68 and 1,468.12 and marked by the grey rectangle. The ascending 50.0 and 61.8 Fibonacci Retracement Fan Support Levels are passing through this short-term support zone, adding to upside pressure. This precious metal may test its 38.2 Fibonacci Retracement Fan Support Level, before extending its advance, which is favored to result in a higher high and maintain the bullish chart formation.
A renewed push to the upside is expected to take gold back into its resistance zone located between 1,486.43 and 1,493.92, as marked by the red rectangle. The bottom range additionally marks the end-point of the redrawn Fibonacci Retracement Fan sequence. Given the long-term fundamental outlook for the global economy, a breakout and extension of the advance are favored to materialize. The next resistance zone awaits gold between 1,510.64 and 1,519.20; you can learn more about a resistance zone here.
Gold Technical Trading Set-Up - Breakout Extension Scenario
Long Entry @ 1,475.00
Take Profit @ 1,519.00
Stop Loss @ 1,461.00
Upside Potential: 4,400 pips
Downside Risk: 1,400 pips
Risk/Reward Ratio: 3.14
In case of a breakdown in the Force Index below its ascending support level, gold may attempt a breakdown below its short-term support zone. The downside potential remains limited to its long-term support zone, located between 1,445.42 and 1,452.42; the top range is likely to halt any short-term corrective phase. This would additionally represent an outstanding long-term buying opportunity.
Gold Technical Trading Set-Up - Limited Breakdown Scenario
Short Entry @ 1,459.00
Take Profit @ 1,452.50
Stop Loss @ 1,462.00
Downside Potential: 650 pips
Upside Risk: 300 pips
Risk/Reward Ratio: 2.17

