The difference between success and failure in Forex trading is very likely to depend upon which currency pairs you choose to trade each week, and not on the exact trading methods you might use to determine trade entries and exits. Each week I am going to analyze fundamentals, sentiment and technical positions in order to determine which currency pairs are most likely to produce the easiest and most profitable trading opportunities over the next week. In some cases, it will be trading the trend. In other cases, it will be trading support and resistance levels during more ranging markets.
Big Picture 1st December 2019
In my previous piece last week, I forecasted that the best trade would be going short of the EUR/USD currency pair following a daily close below 1.0993. We did not get such a daily close last week, therefore there was no trade.
Last week’s Forex market saw the strongest rise in the relative value of the British Pound, and the strongest fall in the relative value of the Japanese Yen.
Fundamental Analysis & Market Sentiment
Fundamental analysts are tilting in favor of the view that the recent quarter-point cut in the U.S. interest rate will be the last cut for a while, with Jerome Powell signaling there are likely to be no further cuts in a while upbeat on the U.S. economy.
The U.S. economy is still growing, but there are some fears of a pending recession. However, the benchmark U.S. stock index, the S&P 500, ended the week not far from its all-time high price. However, there are increasing fears over progress towards a U.S. – China trade deal due to tensions over Hong Kong. The U.S. Dollar rose a little over the week.
There are few long-term trends in the Forex market, except the bullish trend in USD/JPY, and a bearish trend in the EUR/GBP currency cross. I am wary of trading EUR/GBP short as I think Pound strength will tail off over the next week or so as we get closer to the date of the British general election with the opinion polls showing signs of tightening.
Technical Analysis
U.S. Dollar Index
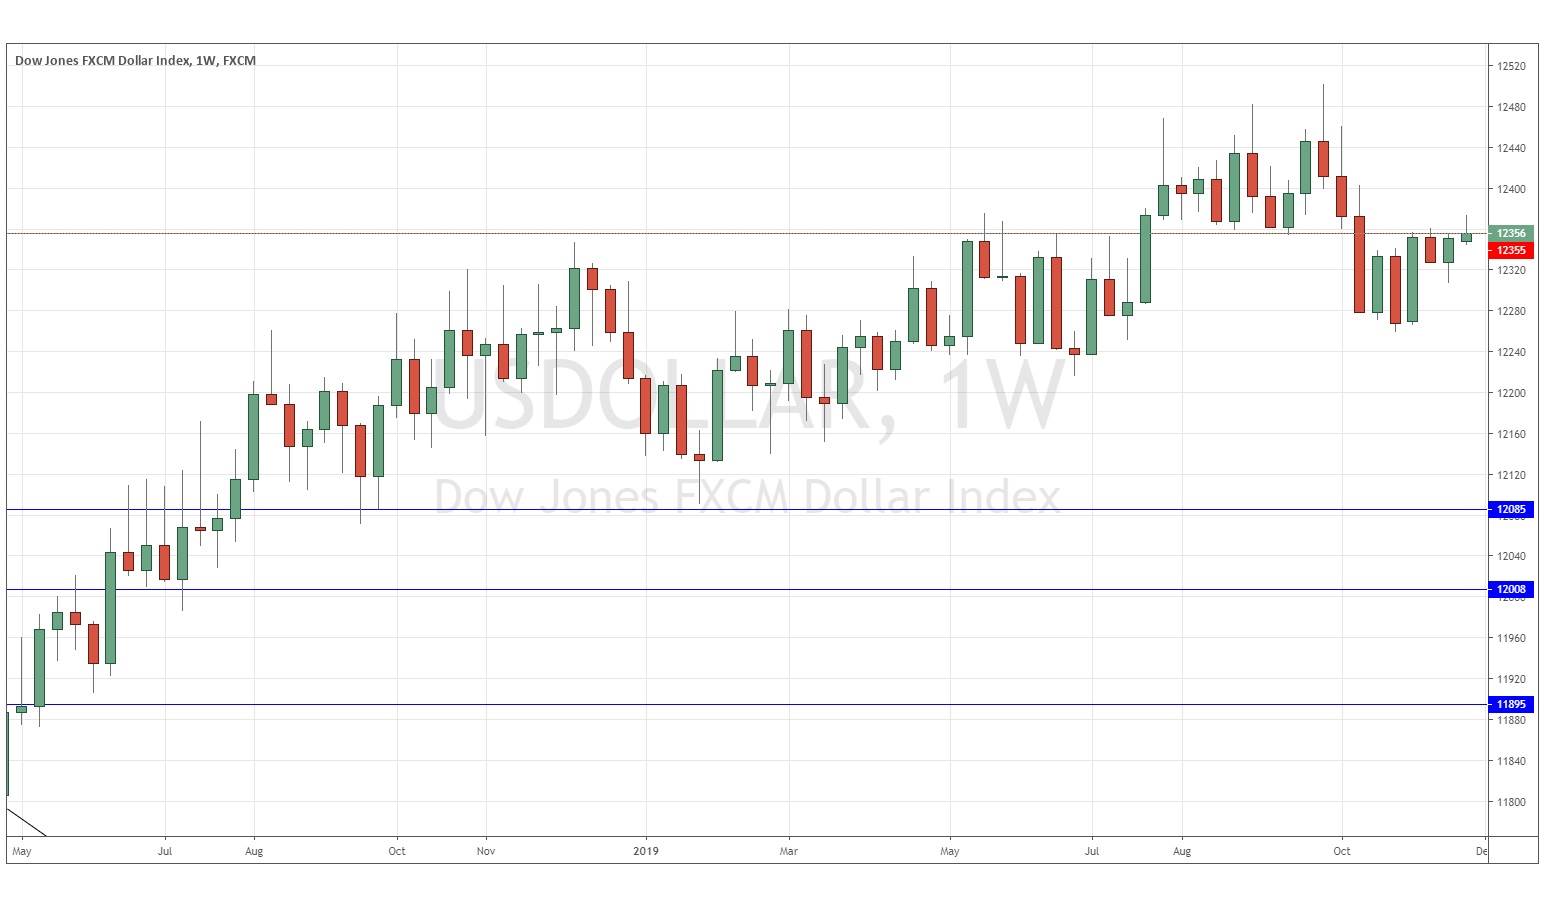
The weekly price chart below shows last week printed a very small near-pin candlestick, which closed just below the resistance level at 12355, but also closed in the lower half of its price range. The price is below its level from 3 months ago, but above its level from 6 months ago. However, it is below the resistance level at 12355. We have a mixture of bullish and bearish signs here, suggesting that next week’s action is unpredictable.
S&P 500 Index
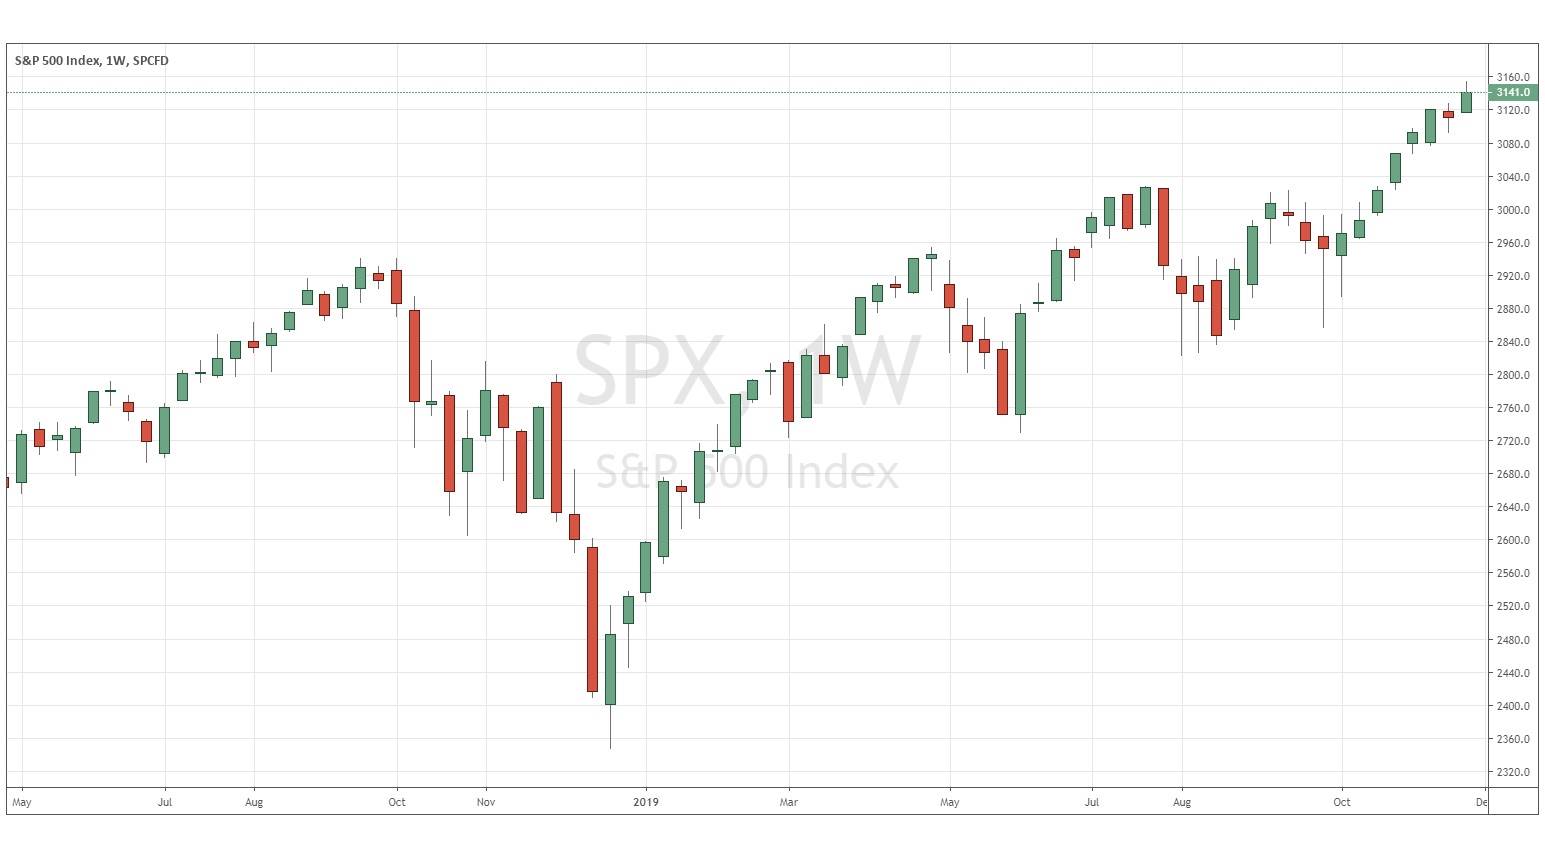
The weekly price chart below shows that last week printed a mildly bullish candlestick of average to small size, which closed within its top half at an all-time weekly high closing price. These are bullish signs, but I would like to see a New York close above 3154 before taking a long trade in line with this strongly bullish trend.
USD/JPY
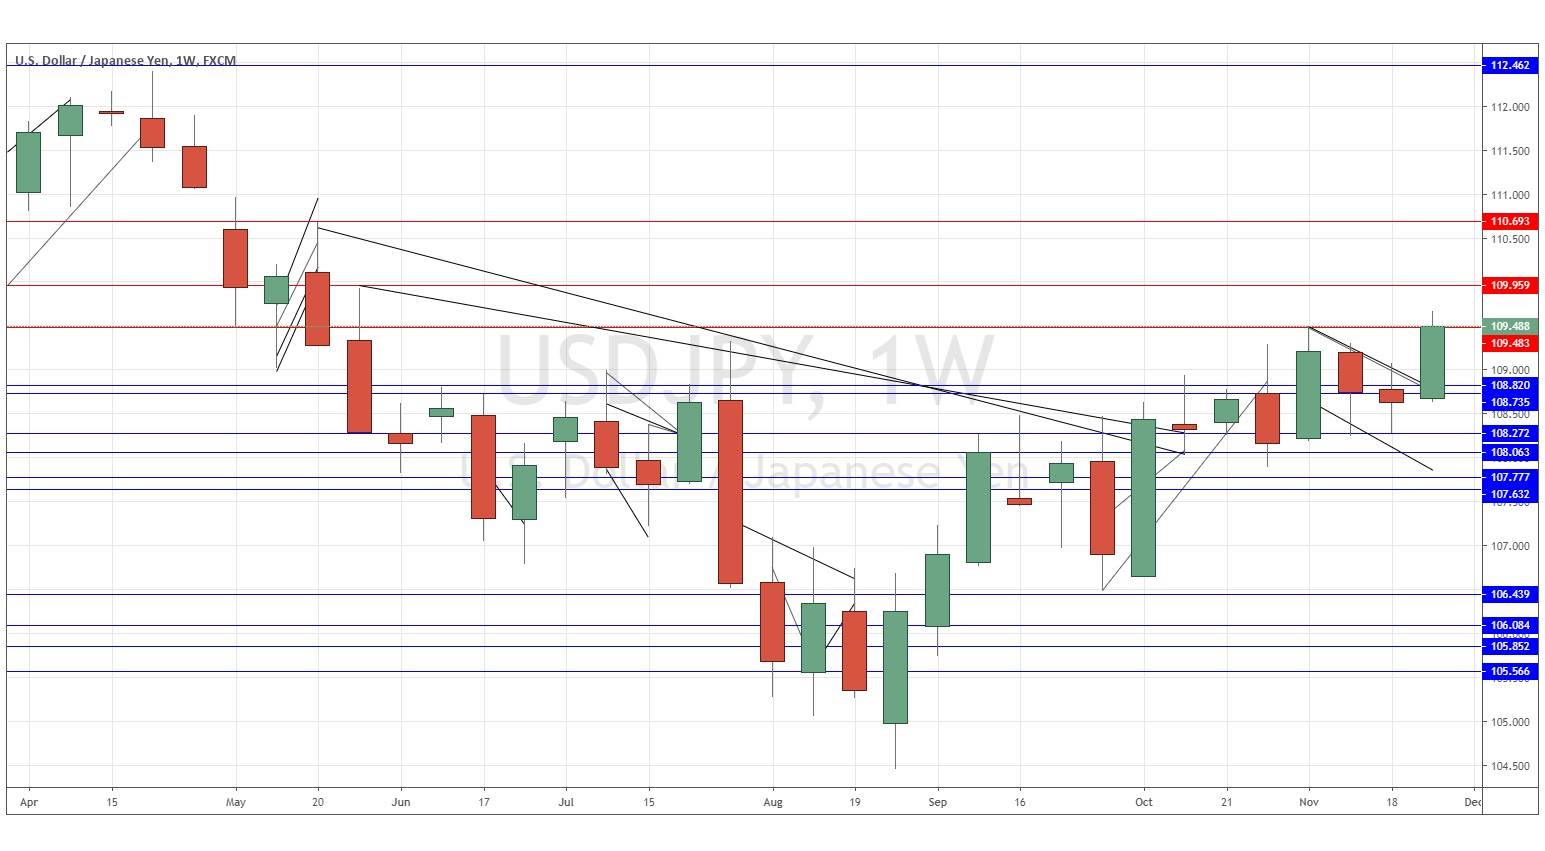
The weekly price chart below shows that last week printed a strongly bullish candlestick of small size, which closed within its top half above all its weekly closing prices of the last 6 months. These are bullish signs, but I would like to see a New York close above 109.50 before taking a long trade in line with this bullish trend.
GBP/USD
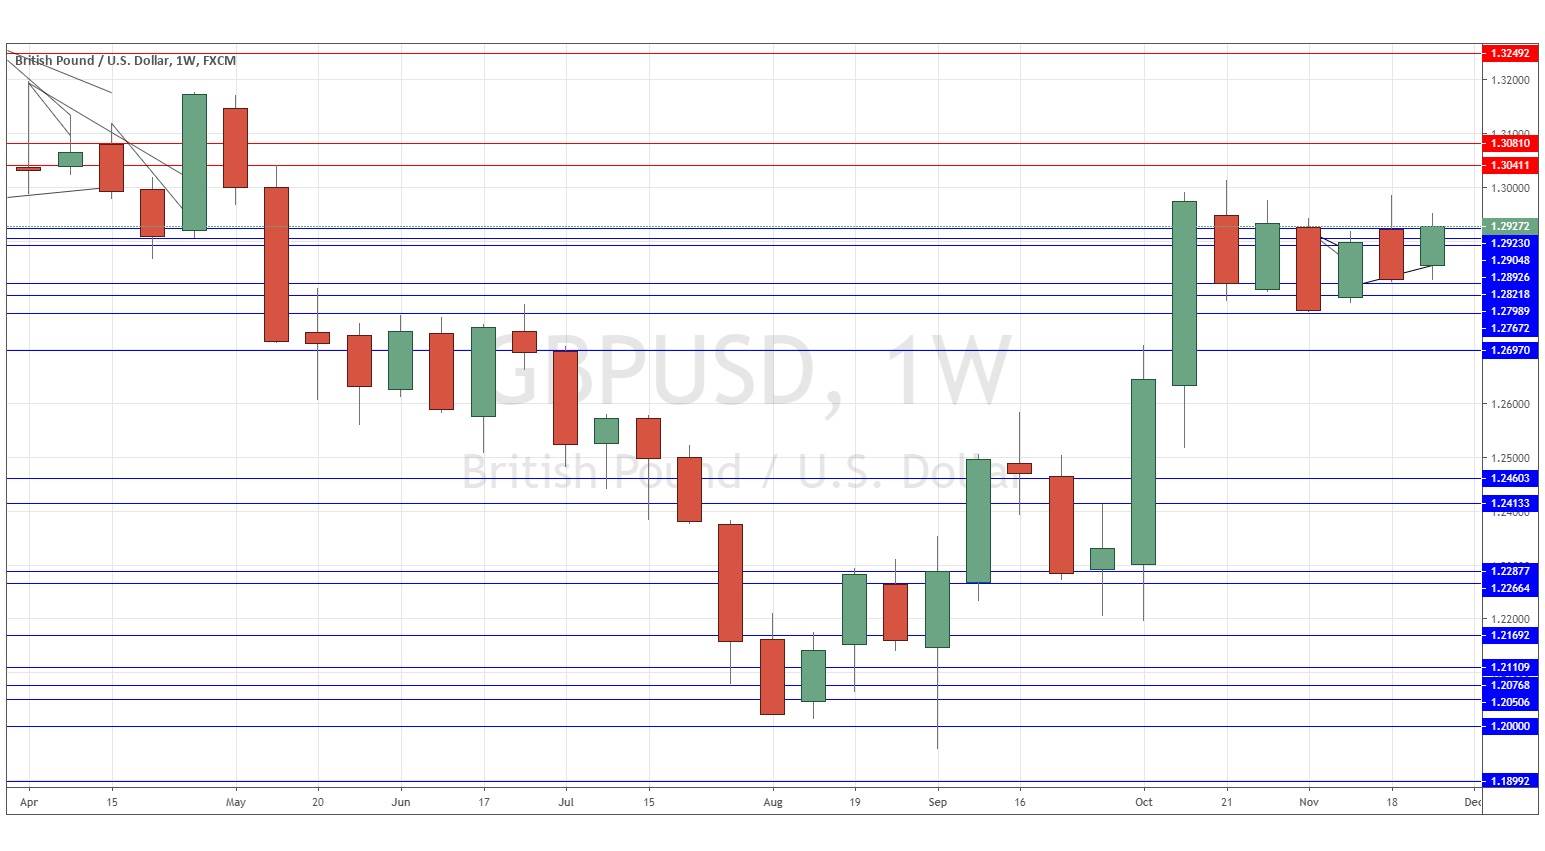
Over the past 6 weeks, the price has been contained within a narrow range from about 1.2750 to just under 1.3000 in what should be called a bullish flag or pennant pattern, as shown in the chart below. The price is poised for a bullish breakout beyond the 1.3000 area if the Government secures a solid majority in Parliament on the 12th December U.K. election which would enable it to set a well-defined path to Brexit at the end of January, which would provide certainty to the market and boost the British Pound. There is no trade here yet, but this bullish consolidation is a pattern to be aware of.
Conclusion
This week I forecast the best trades are likely to be long of the S&P 500 Index following a daily (New York) close above 3154 and long of the USD/JPY currency pair following a daily (New York) close above 109.50.


