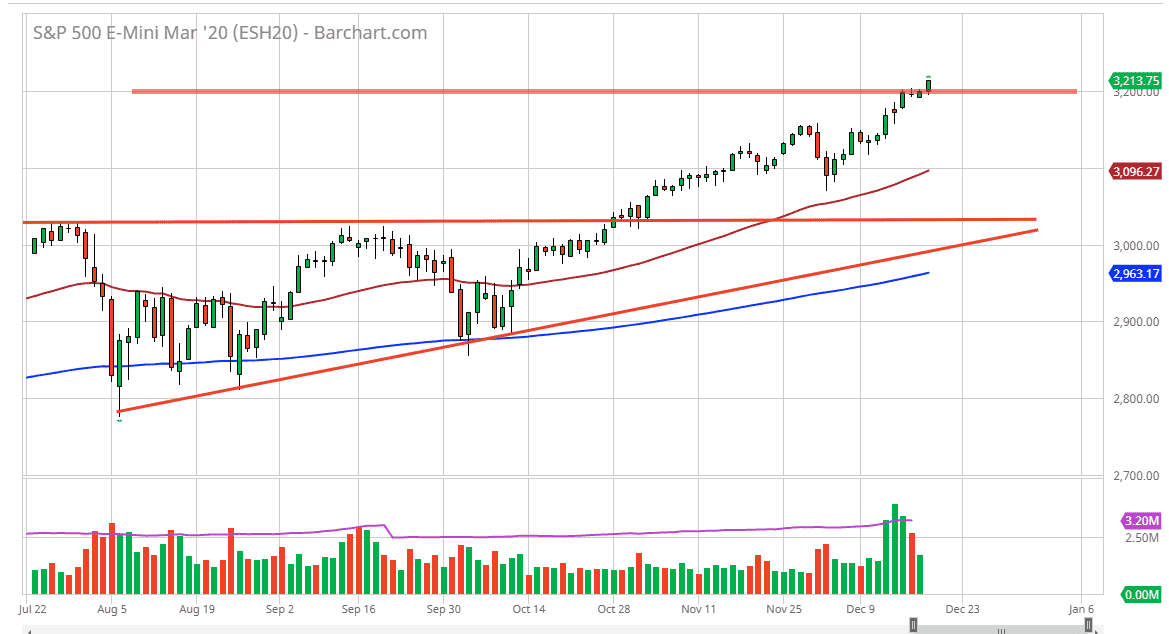
The S&P 500 has rallied during the trading session on Thursday, breaking above the 3200 level which is an area that has been a target for some time. Based upon the ascending triangle underneath, that was the level that I was calling for, and now that we have clear that level it looks very likely that we continue to go even higher. By breaking above the 3200 level it looks as if we are ready to go to the upside but keep in mind that Friday unfortunately is options expiration, and that could cause a bit of very strange action during the day.
The 50 day EMA underneath will offer support, even if we do get a bit of a breakdown. The 3100 level is an area that has a certain amount of psychological importance to it, as well as structural due to the recent bounce. All things being equal though, this is the time a year where we see a lot of money managers try to pad results so that they can start talking to the clients about all the money they made. That is the essential reason for the “Santa Claus rally” that happens every year. Beyond that, there is also the Federal Reserve on the sidelines and not looking to do anything along the lines of tightening. In fact, with the recent economic figures that we have seen, one can make an argument that the Federal Reserve will be loosening monetary policy in 2020. It’s a bit early to say that, but I do know that some pundits out there are starting to suggest that could happen.
Ultimately, we are in an uptrend and that’s truthfully the only thing that matters. If we do pullback from here, I think it’s not until we break below the 200 day EMA that you can take a break down seriously. The market is extraordinarily bullish as it has been for some time, so therefore it seems like as every time we pull back, people will be looking at that as value that they can take advantage of and I suspect that there will be a lot of “fear of missing out” in the world. That being said, there will be a lack of liquidity over the next couple of days and therefore it could cause a bit of erratic momentum on short-term charts, so be careful.


