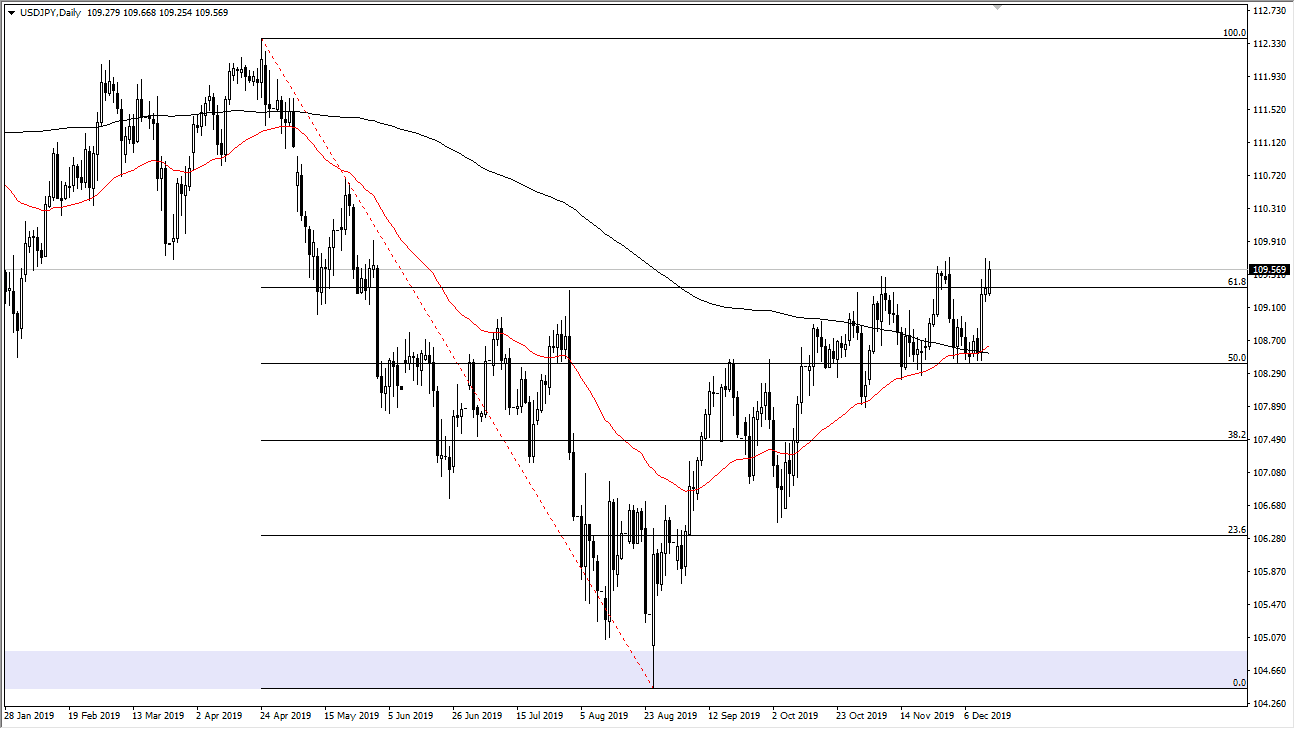
The US dollar has rallied a bit during the trading session on Monday but continues to look a little bit hesitant to try to break out against the Japanese yen. The ¥110 level continues to be a major barrier to overcome, and quite frankly we can’t do so until we get a major “risk on rally” in general. Looking at the ¥110 level, we have seen a lot of resistance there previously, and therefore it’s can it take a lot to get above there. If we do get some type of major “risk on event”, which supposedly we were supposed to be getting with the “Phase 1 deal”, and at this point we haven’t exactly shot through the roof due to that. That being the case, it looks as if we are simply going to grind back and forth going forward.
If we were to break above the ¥110 level, then the market is likely to go looking towards the ¥111 level where a major gap is found. That gap of course will attract a lot of people, and therefore we could get a pull back from there. That being said though, if we were to break above the ¥110 level, I think it’s only a matter of time before we get that move, but we need an extra boost it seems. The market had been focused so much on Brexit and Phase 1, that now it’s hard to tell what will cause that move. Clearly though, we have seen quite a bit of resiliency, so it does make sense that we could eventually do so. I think at this point pullbacks will continue to be buying opportunities in a market that has shown so much in the way of resiliency.
That being said, if we were to break down below the ¥108.50 level on a daily close, that could change a lot in send this market much lower. That will obviously be more “risk off”, and perhaps cause major issues. Ultimately, this is a market that will continue to move back and forth with the risk appetite in general, but it does look like the buyers are still in control from a longer-term standpoint. I look at pullbacks as a potential buying opportunities, until course we break down below that crucial support level. We have recently seen the “golden cross” form, which is the 50 day EMA crossing above the 200 day EMA which of course is bullish.

