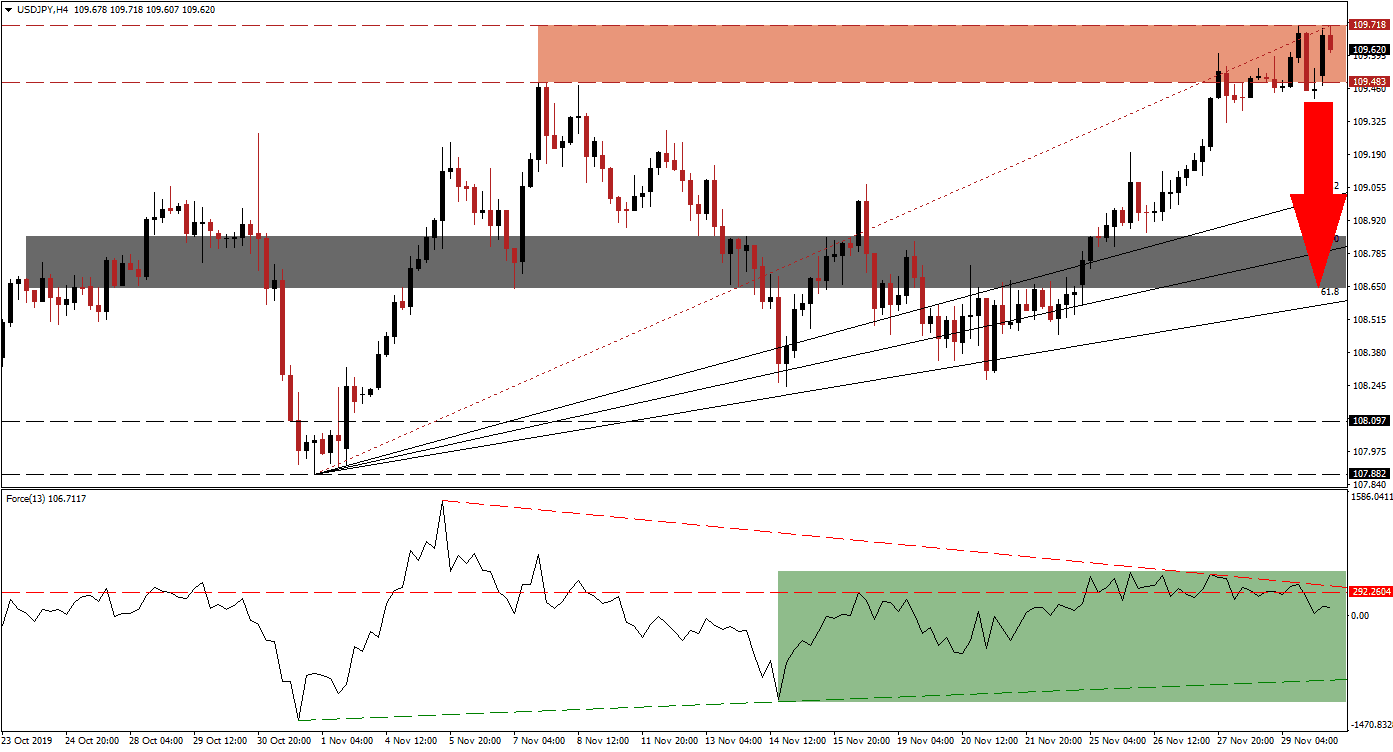
Japanese company sales and profits decreased for the third quarter, but capital spending accelerated. This countered the negative impact of disappointing sales figures and brightened the outlook for the fourth quarter. The USD/JPY has exhausted its upside potential and is now losing bullish momentum inside of its resistance zone. Another bearish development emerged as this currency pair moved below its Fibonacci Retracement Fan trendline. You can learn more about the Fibonacci Retracement Fan here.
The Force Index, a next-generation technical indicator, shows the emergence of a negative divergence; this bearish trading signal formed before the move by this currency pair into its resistance zone. The Force Index has additionally moved below its horizontal support level, turning it into resistance as marked by the green rectangle. This technical indicator is on track to move below the 0 centerline, placing bears in charge of the USD/JPY and preceding a breakdown in price action. Any move lower in the Force Index may extend into its ascending support level.
A breakdown in the USD/JPY below its resistance zone, located between 109.483 and 109.718 as marked by the red rectangle, may lead to a profit-taking sell-off. This will provide the downside momentum for this currency pair to close the gap to its ascending 38.2 Fibonacci Retracement Fan Support Level. Forex traders are advised to monitor the intra-day low of 109.323, this marks the low of a failed breakdown in price action below its resistance zone that was reversed. A move below this level is expected to result in the addition of new net sell positions. You can learn more about a breakdown here.
Today’s ISM Manufacturing PMI may provide the next fundamental catalyst for this currency pair. Markets expect this report to show the contraction in the manufacturing sector to extend at a decreased pace; the new orders sub-component will be of specific interest. Any disappointment in this data set is anticipated to add to the build-up in bearish pressures evident in this currency pair. A corrective phase may take the USD/JPY down into its support zone located between 108.641 and 108.853 as marked by the grey rectangle; the 50.0 Fibonacci Retracement Fan Support Level is passing through this zone.
USD/JPY Technical Trading Set-Up - Breakdown Scenario
⦁ Short Entry @ 109.650
⦁ Take Profit @ 108.650
⦁ Stop Loss @ 109.950
⦁ Downside Potential: 100 pips
⦁ Upside Risk: 30 pips
⦁ Risk/Reward Ratio: 3.33
In the event of a breakout in the Force Index above its descending resistance level, the USD/JPY may attempt a breakout above its resistance zone. Given the negative sentiment regarding the US-China trade negotiations, the long-term fundamental outlook for this currency pair remains bearish. The next resistance zone awaits price action between 110.308 and 110.668 which represents a solid short-selling opportunity.
USD/JPY Technical Trading Set-Up - Limited Breakout Scenario
⦁ Long Entry @ 110.150
⦁ Take Profit @ 110.600
⦁ Stop Loss @ 109.950
⦁ Upside Potential: 45 pips
⦁ Downside Risk: 20 pips
⦁ Risk/Reward Ratio: 2.25


