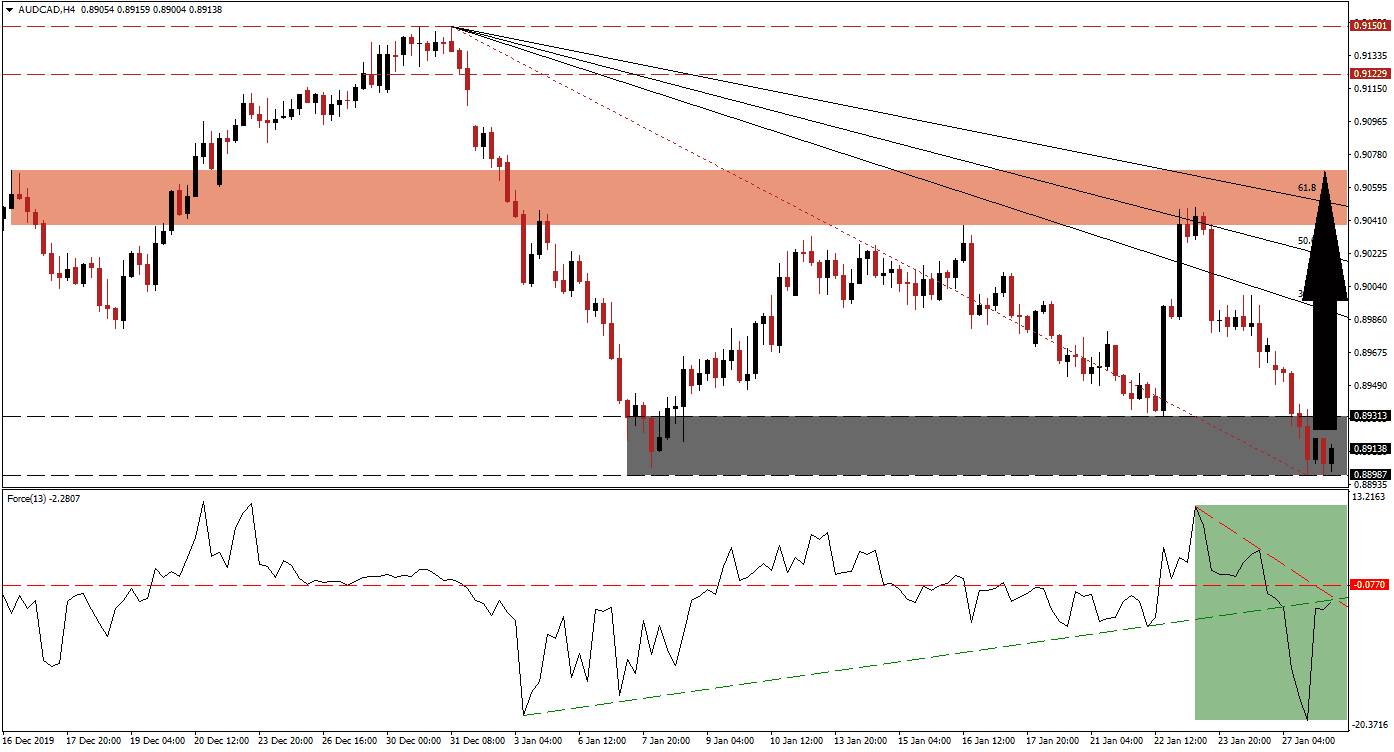
As the new string of a deadly coronavirus spreads around the world, Asian economies are the most directly impacted ones. The virus originated in China, but cases have been reported in over dozens of countries with over 3,000 confirmed infections and a death toll that exceeds 100. Since the Australian Dollar is the primary Chinese Yuan proxy currency, it faced heavy selling pressure. The AUD/CAD reversed from a higher high into a lower low but is now stabilizing inside of its support zone.
The Force Index, a next-generation technical indicator, confirmed the collapse in price action with a sharp contraction and a lower low of its own. This took it below its horizontal support level, converting it into resistance, and then below its ascending support level. The Force Index quickly recovered, as marked by the green rectangle, and is now on the verge of a triple breakout. With the descending resistance level crossing below its ascending support level, a push higher in this technical indicator is expected to lead the AUD/CAD into a reversal. You can learn more about the Force Index here.
Adding to bullish developments in this currency pair is the move above its Fibonacci Retracement Fan trendline that materialized inside of its support zone. This zone is located between 0.88987 and 0.89313, as marked by the grey rectangle. A breakout is anticipated to close the gap between the AUD/CAD and its descending 38.2 Fibonacci Retracement Fan Resistance Level. The Australian bond market rally may entice more buyers into the currency due to record low yields, adding a much needed positive fundamental catalyst.
Price action is likely to advance back into its short-term resistance zone located between 0.90384 and 0.90694, as marked by the red rectangle. A short-covering rally is favored to partially fuel this advance. With the Australian and Canadian Dollars the two top hard commodity currencies, the former’s close ties to the Chinese economy, should boost the AUD/CAD in the long-term. Forex traders are advised to monitor price action for a higher high above 0.90485, which will precede an extension of the pending breakout sequence. You can learn more about a breakout here.
AUD/CAD Technical Trading Set-Up - Short-Covering Scenario
- Long Entry @ 0.89150
- Take Profit @ 0.90600
- Stop Loss @ 0.88750
- Upside Potential: 145 pips
- Downside Risk: 40 pips
- Risk/Reward Ratio: 3.63
In the event of a move to the downside in the Force Index, pressured by its descending resistance level, the AUD/CAD is expected to attempt a breakdown. Due to the long-term fundamental outlook in this currency pair, the downside appears limited to its next support zone. Price action will face this zone between 0.87420 and 0.87820, dating back to May 2007. This should be considered an excellent buying opportunity.
AUD/CAD Technical Trading Set-Up - Limited Breakdown Scenario
- Short Entry @ 0.88550
- Take Profit @ 0.87700
- Stop Loss @ 0.88900
- Downside Potential: 85 pips
- Upside Risk: 35 pips
- Risk/Reward Ratio: 2.43

