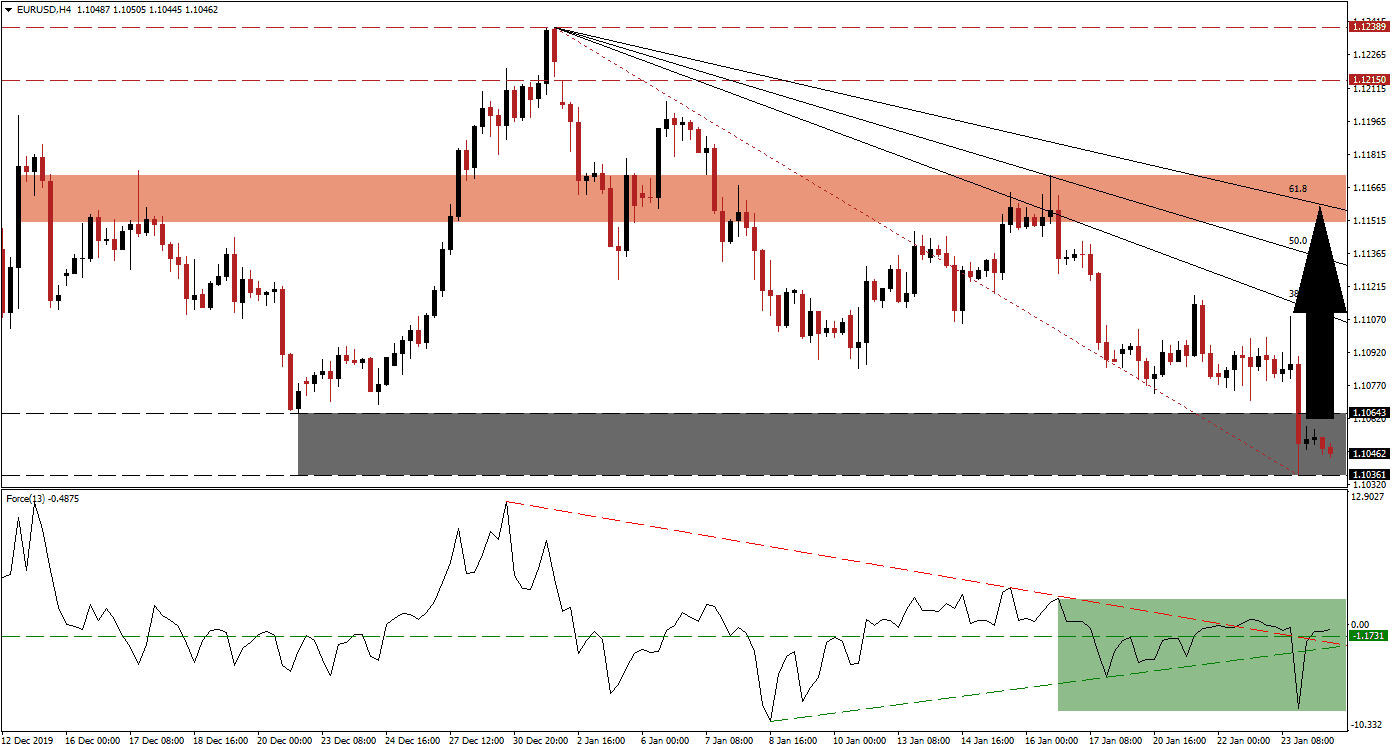
Following a lower low in the EUR/USD, the downtrend remains intact but technical developments suggest a short-covering rally is brewing. Today’s preliminary PMI data out of the Eurozone, with France and Germany, also reporting, may provide the next fundamental catalyst for price action. The divided ECB has restarted its quantitative easing program on November 1st 2019, to the tune of €20 billion per month, while ignoring growing consensus that it is counter-productive. You can learn more about a short-covering rally here.
The Force Index, a next-generation technical indicator, provided an early signal that the downtrend may soon be interrupted. As this currency pair dropped to a lower low, a lower high was recorded in the Force Index, and a positive divergence formed. This technical indicator quickly recovered to the upside with a triple breakout. After pushing above its ascending support level as well as its descending resistance level, it converted its horizontal resistance level into support, as marked by the green rectangle. A crossover above the 0 center-line is favored to palace bulls in control of the EUR/USD.
Adding to bullish developments in this currency pair is the move above its Fibonacci Retracement Fan trendline. This occurred inside of its support zone located between 1.10361 and 1.10643, as marked by the grey rectangle. A breakout above this zone is expected to initiate a short-covering rally, which will close the gap between the EUR/USD and its descending 38.2 Fibonacci Retracement Fan Resistance Level. Forex traders are advised to monitor the intra-day high of 1.11083, the peak of a previous push higher, as a breakout above this level will end the dominant downtrend.
This currency pair is anticipated to accelerate into its short-term resistance zone located between 1.11509 and 1.11721, as marked by the red rectangle. It is currently being enforced by the 61.8 Fibonacci Retracement Fan Resistance Level, which will challenge any advance. With the long-term outlook for the EUR/USD bullish, on the back of US Dollar weakness and issues in the interbank lending market, a breakout cannot be ruled out. A new catalyst will be required to push price action into its long-term resistance zone located between 1.12150 and 1.12389.
EUR/USD Technical Trading Set-Up - Breakout Extension Scenario
- Long Entry @ 1.10450
- Take Profit @ 1.11550
- Stop Loss @ 1.10150
- Upside Potential: 110 pips
- Downside Risk: 30 pips
- Risk/Reward Ratio: 3.67
Should the Force Index fail to extend its advance and drop below its descending resistance level, which acts as temporary support, a breakdown in the EUR/USD is likely to follow. Given the bullish outlook for this currency pair, the downside potential remains limited to its next support zone, which will represent a good buying opportunity for forex traders to consider. This zone awaits price action between 1.08789 and 1.09082.
EUR/USD Technical Trading Set-Up - Limited Breakdown Scenario
- Short Entry @ 1.09900
- Take Profit @ 1.09000
- Stop Loss @ 1.10350
- Downside Potential: 90 pips
- Upside Risk: 45 pips
- Risk/Reward Ratio: 2.00

