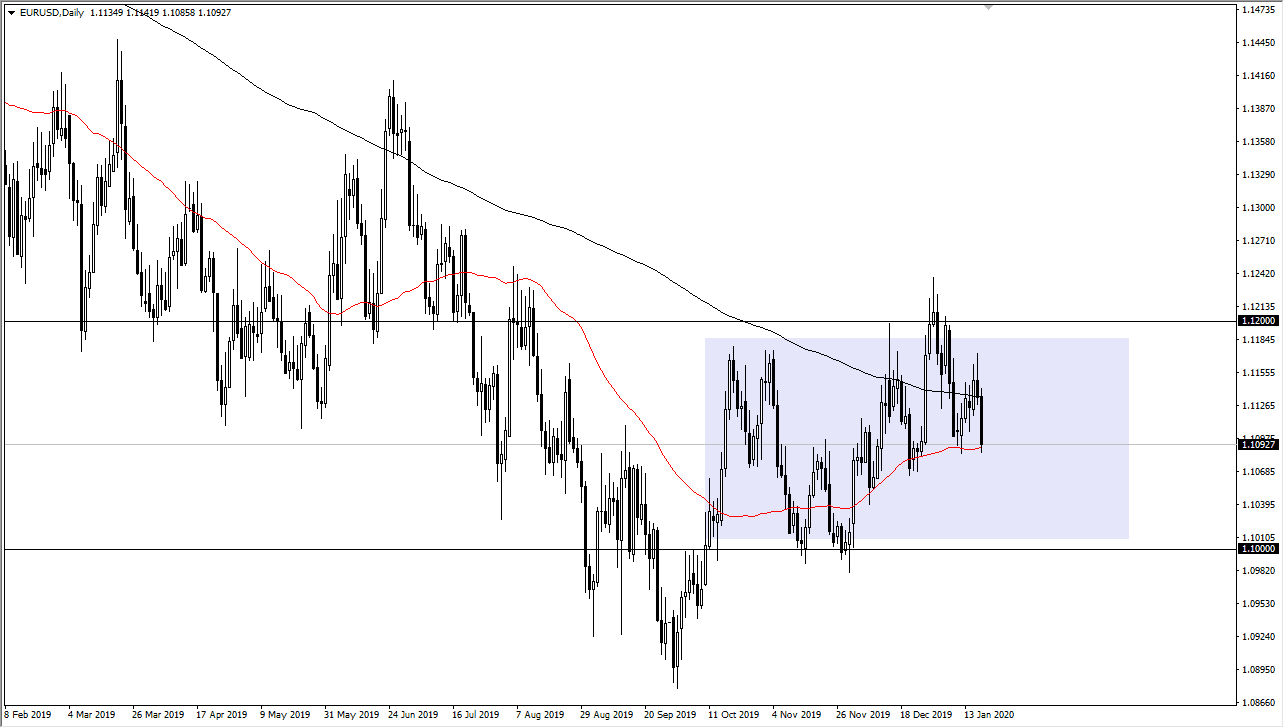
The Euro has broken down a bit during the trading session on Friday, reaching towards the 50 day EMA. Ultimately, this is a market that continues to see a lot of volatility, but we are just below the 1.11 handle. That is the middle of the 200 point range that we have been in for some time, with the 1.12 level offering significant resistance, while the 1.10 level has been a strong floor.
Looking at this market, plenty of volatility continues to be a mainstay, but quite frankly it doesn’t seem like it has a lot of directional drive. Having said that, if the market reaches out to those outer levels, I think that the traders will come back into either buy or sell based upon where we are. This is a market that’s going to continue to be very messy, and quite frankly the fact that we are sitting on top of the 50 day EMA suggests that we could turn right back around. The shooting star from the trading session on Thursday will continue to offer a bit of resistance as well, but ultimately this is a market that you should be looking for 15 to 20 pips moves at best anyway. This is the domain of high-frequency traders, and therefore it’s difficult to get any real traction without some type of major fundamental shift. We don’t have that right now, as the central banks from both countries appear to be rather weak.
The question is whether or not the US dollar is rising or falling overall, and that’s probably what drives this pair. There’s not a lot going on here, so I don’t typically like trading it. Until we break out of this purple box that I have on the chart, there’s really not a lot to do other than either buy it when it gets to an extreme lower level or sublet once we get towards the top. The candlestick of course is negative, and it does look like we may be trying to make a lower low, but even then, I believe that the downside would be relatively limited at this point. Unless you are willing to trade very short term charts, you probably are going to struggle making money in this market. Longer-term trading is almost impossible, as you can see on this very choppy and jagged chart.


