Safe-haven assets are being led higher by gold after the US stirred up tensions in the Middle East to start the new decade. The killing of a top Iranian general in Iraq is expected to lead to retaliatory actions by Iran, but to which extent is unknown. An outright attack on US military installations in the Middle East is unlikely, as it would unite countries against Iran. An increase in military drills which would block oil traffic through the Strait of Hormuz could derail the global economy further, but other options remain a possibility. Gold has carved out a fresh resistance zone, from where a fresh breakout is anticipated.
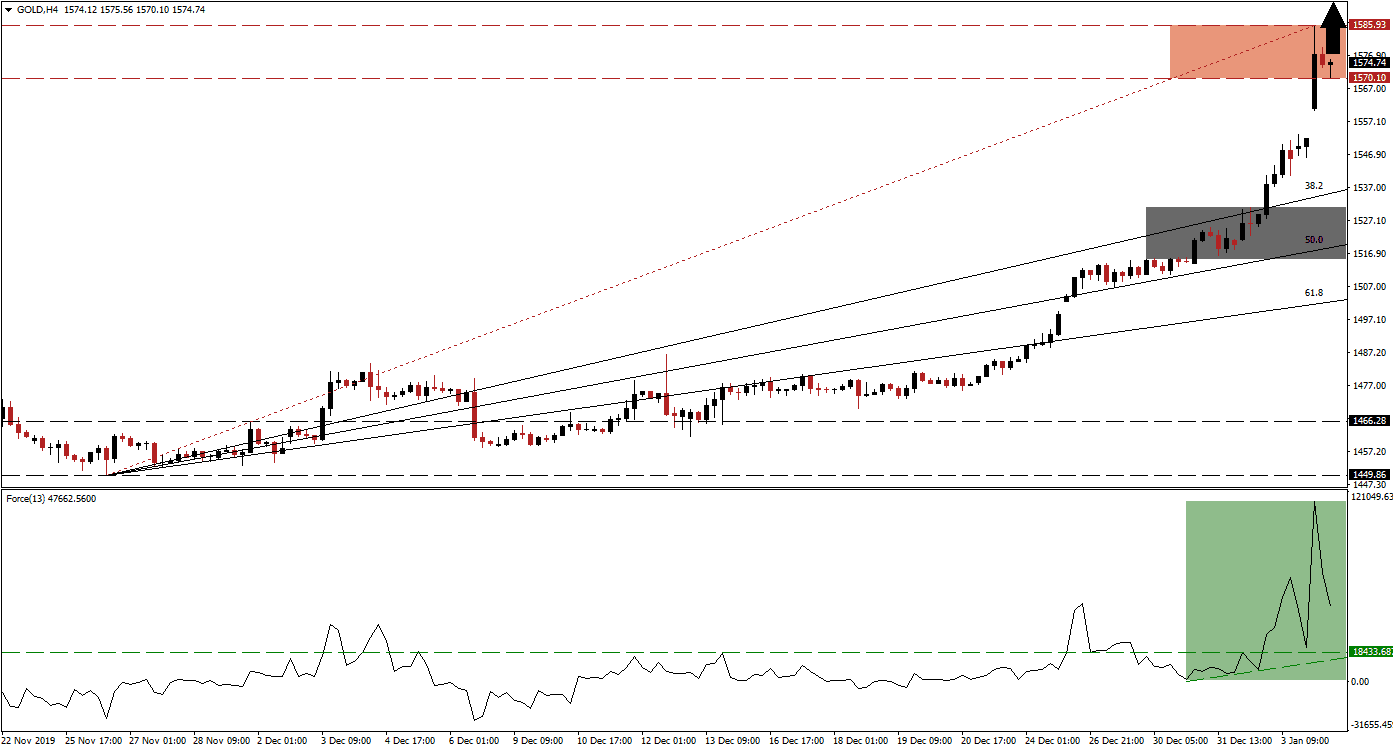
The Force Index, a next-generation technical indicator, spiked to fresh highs and supports the long-term bullish outlook. After this precious metal reached its resistance zone, bullish momentum receded from its peak. The Force Index maintains its position deep in positive territory and bulls remain in charge of gold. A new ascending support level is emerging, as marked by the green rectangle, and this technical indicator may descend into it before a resumption of the uptrend. A series of higher highs and higher lows is favored to extend the advance, leading to fresh multi-year highs in this commodity.
This precious metal pushed into its new resistance zone with a price gap to the upside. Price action may close this gap, from where a breakout is favored to materialize. The resistance zone is located between 1,570.10 and 1,585.93, as marked by the red rectangle. As a result of the strong rally, price action is disconnected from its ascending 38.2 Fibonacci Retracement Fan Support Level, suggesting that a corrective phase or sideways trend in gold cannot be ruled out. The rally has already eclipsed the 2019 intra-day high, and a short-term breakout above $1,600 is likely. The next resistance zone is located between 1,674.56 and 1,696.41.
Middle East tensions are certain to escalate, having a negative impact on the regional economy as well as security. Iraq passed a resolution yesterday to expel all foreign troops and to ban the usage of its sovereign landmass, airspace, and territorial waters. US President Trump warned against tougher sanctions on Iraq than imposed on Iran if the process is not executed properly. The response of other regional players is awaited, but a breakout in gold on the back of safe-haven demand is anticipated. Volatility is expected to remain elevated, which could span the rest of 2020. You can learn more about a breakout here.
Gold Technical Trading Set-Up - Breakout Extension Scenario
Long Entry @ 1,570.00
Take Profit @ 1,695.00
Stop Loss @ 1,531.00
Upside Potential: 12,500 pips
Downside Risk: 3,900 pips
Risk/Reward Ratio: 3.21
In the event of a contraction in the Force Index below its horizontal support level, gold may enter a profit-taking sell-off. Given the dominant bullish fundamental outlook, enforced by the emerging technical scenario, the downside potential remains limited to its next short-term support zone. This zone is located between 1,515.07 and 1.531.07, as marked by the grey rectangle. Traders should consider this as an excellent buying opportunity.
Gold Technical Trading Set-Up - Limited Breakdown Scenario
Short Entry @ 1,555.00
Take Profit @ 1,525.00
Stop Loss @ 1,570.00
Downside Potential: 3,000 pips
Upside Risk: 1,500 pips
Risk/Reward Ratio: 2.00

