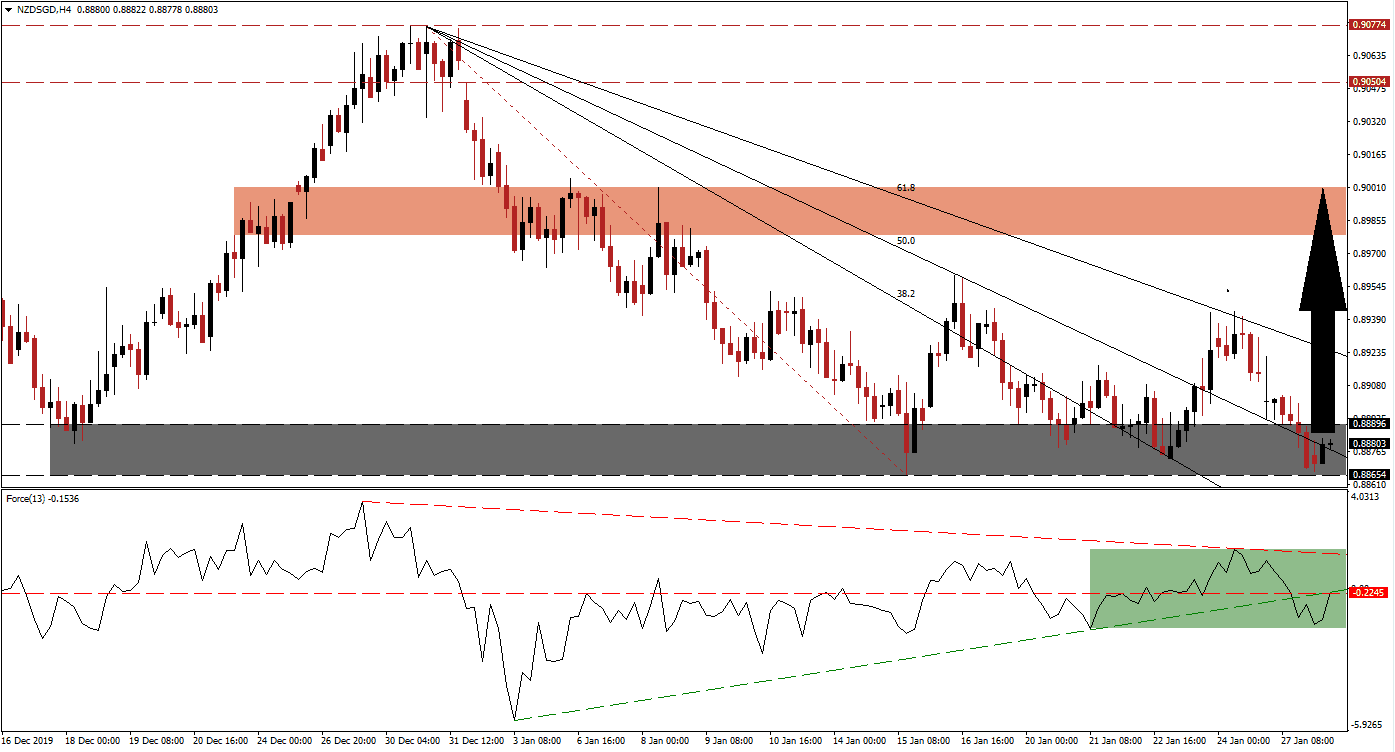
Following a sharp corrective phase, the NZD/SGD entered a sideways trend after moving into a substantial support zone. The Singapore economy has shown signs of weakness, and the spread of the deadly coronavirus is adding downside pressure to the export-oriented city-state. Capital inflows from Hong Kong have peaked, and the catalyst priced into the Singapore Dollar. Tourism in New Zealand will face a negative impact but is expected to remain a short-term disruption, with the long-term outlook for this currency pair bullish. You can learn more about a support zone here.
The Force Index, a next-generation technical indicator, points towards a momentum recovery after briefly contracting below its ascending support level. The Force Index is now in the process of converting its horizontal resistance level into support, as marked by the green rectangle. It will also push it back above its ascending support level. After this technical indicator elevates into positive conditions, placing bulls in charge of the NZD/SGD, it is likely to close the gap to its descending resistance level.
With the descending Fibonacci Retracement Fan sequence passing through the support zone located between 0.88654 and 0.88896, as marked by the grey rectangle, pressures for a breakout or breakdown are on the rise. Given dominant fundamental factors in this currency pair, a breakout is favored to initiate a short-covering rally in the NZD/SGD, and push it above is 61.8 Fibonacci Retracement Fan Resistance Level. You can learn more about a short-covering rally here.
Forex traders are advised to monitor the intra-day high of 0.89428, the peak of the previously reversed breakout attempt, which marked a lower high. A push above this level is anticipated to result in the addition of new net buy orders in this currency pair. This should provide enough momentum for the NZD/SGD to challenge its short-term resistance zone located between 0.89785 and 0.90010, as marked by the red rectangle. A further breakout may extend the breakout sequence into its long-term resistance zone between 0.90504 and 0.90774.
NZD/SGD Technical Trading Set-Up - Breakout Scenario
- Long Entry @ 0.88800
- Take Profit @ 0.90000
- Stop Loss @ 0.88450
- Upside Potential: 120 pips
- Downside Risk: 35 pips
- Risk/Reward Ratio: 3.43
A failed breakout in the Force Index above its ascending support level is expected to pressure the NZD/SGD into a breakdown attempt. Any contraction from current levels will represent an outstanding buying opportunity for Forex traders to consider. The downside potential remains limited to the next support zone, which awaits this currency pair between 0.87305 and 0.87626.
NZD/SGD Technical Trading Set-Up - Limited Breakdown Scenario
- Short Entry @ 0.88250
- Take Profit @ 0.87300
- Stop Loss @ 0.88600
- Downside Potential: 95 pips
- Upside Risk: 35 pips
- Risk/Reward Ratio: 2.71

