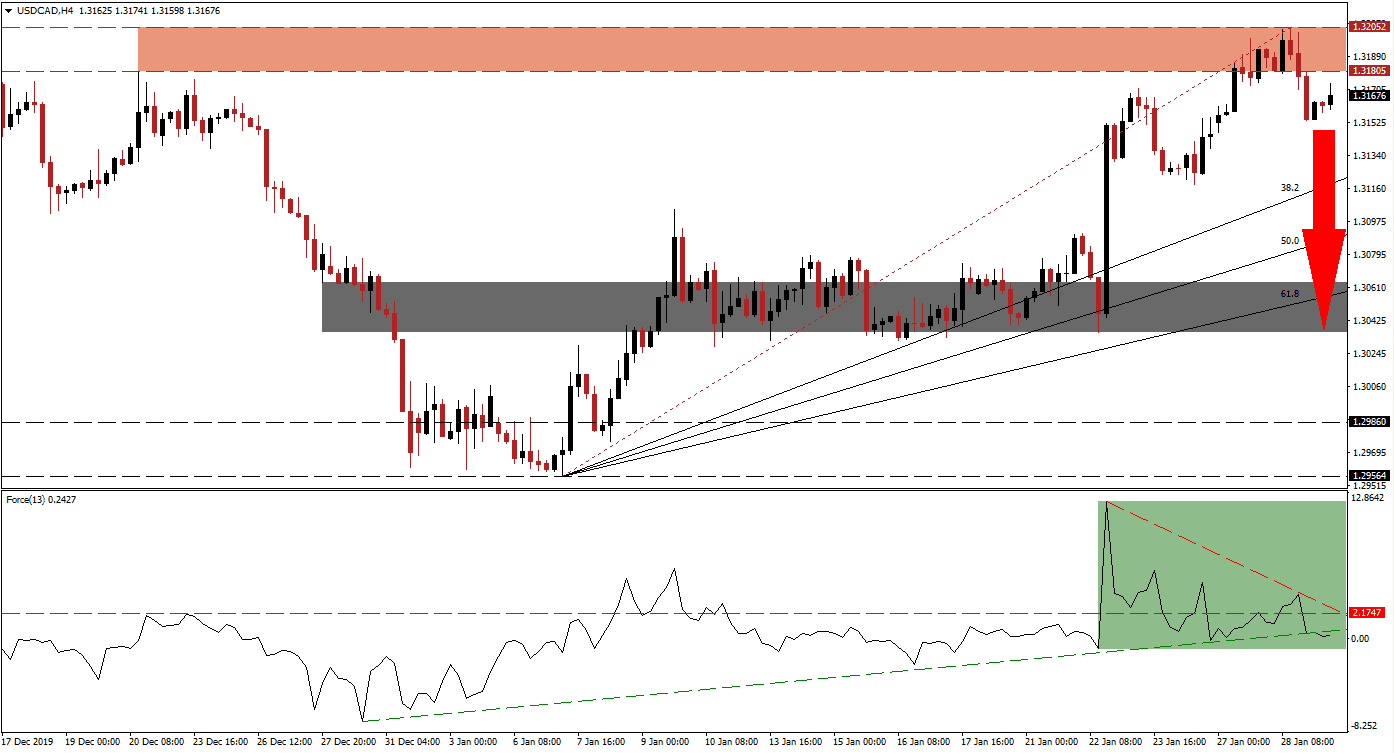
After this currency pair was rejected by its resistance zone, a more massive corrective phase is expected to follow. US economic data continues to disappoint, which should not be dismissed. The Federal Reserve is unlikely to lower interest rates today, but it may feel forced to act this year as fundamental conditions worsen. With disruptions due to the rising threat of a new, deadly string of a coronavirus, the US central bank may alter its outlook. The USD/CAD is vulnerable to a profit-taking sell-off, fueled by a collapse in momentum.
The Force Index, a next-generation technical indicator, suggests a violent sell-off may be imminent. Bullish momentum is fading after the Force Index contracted from a higher high. A series of lower highs emerge as the horizontal support level was transformed into resistance, as marked by the green rectangle. The descending resistance level is adding to downside pressure, anticipated to result in a breakdown below its ascending support level. Bears will take control of the USD/CAD after the Force Index dips below the 0 center-line.
Another bearish development occurred after this currency pair moved below its Fibonacci Retracement Fan trendline. This materialized inside its resistance zone located between 1.31805 and 1.32052, as marked by the red rectangle. The pending corrective phase should close the gap between the USD/CAD and its ascending 38.2 Fibonacci Retracement Fan Support Level. Forex traders are advised to monitor the intra-day low of 1.31536, the low of the current breakdown. A move lower is favored to inspire the next wave of net sell orders.
This currency pair is positioned to accelerate into its next short-term support zone located between 1.30359 and 1.30637, as marked by the grey rectangle. The 61.8 Fibonacci Retracement Fan Support Level is passing through this zone, but a breakdown cannot be ruled out. Economic data out of Canada has mirrored weakness evident across developed economies, but to a lesser extent than that of the US. A fundamental catalyst may extend the breakdown sequence in the USD/CAD into its next long-term support zone between 1.29564 and 1.29860. You can learn more about a breakdown here.
USD/CAD Technical Trading Set-Up - Profit-Taking Scenario
- Short Entry @ 1.31700
- Take Profit @ 1.30350
- Stop Loss @ 1.32100
- Downside Potential: 135 pips
- Upside Risk: 40 pips
- Risk/Reward Ratio: 3.38
In the event of a push by the Force Index above its descending resistance level, the USD/CAD is anticipated to attempt a breakout above its resistance zone. Given the increasingly bearish outlook for this currency pair, the upside appears limited to its next support zone, located between 1.32693 and 1.32900. Any breakout attempt is likely to remain temporary and will represent a sound short-selling opportunity.
USD/CAD Technical Trading Set-Up - Limited Breakout Scenario
- Long Entry @ 1.32250
- Take Profit @ 1.32850
- Stop Loss @ 1.32000
- Upside Potential: 60 pips
- Downside Risk: 25 pips
- Risk/Reward Ratio: 2.40

