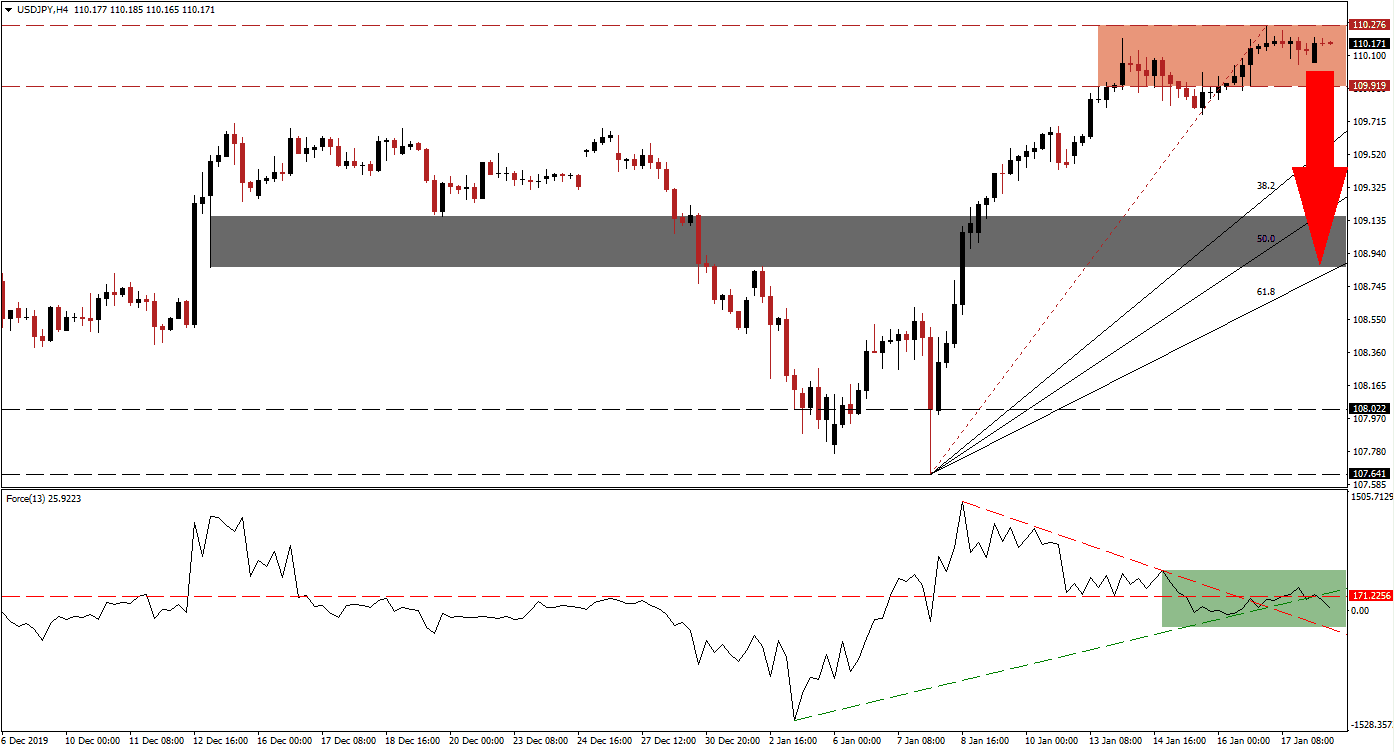
While Japanese economic data continues to disappoint, the Japanese Yen may rally on the back of safe-haven demand amid a weaker than the priced-in global economy. Equity markets in the US have recorded fresh all-time highs on Friday, and optimism remains elevated, but not supported by fundamental factors. The USD/JPY is showing signs of exhaustion inside its resistance zone from a profit-taking sell-off is anticipated to emerge. A rise in volatility is additionally expected to end the uptrend in this currency pair.
The Force Index, a next-generation technical indicator, provided the initial warning sign that the advance is nearing an end. A negative divergence formed as this currency pair expanded with a contraction in the Force Index. Following the conversion of the horizontal support level into resistance, this technical indicator was reversed by its ascending support level. It was followed by a push above its descending resistance level and a breakdown below its ascending support level, as marked by the green rectangle. More downside is likely to drop the Force Index into negative territory, granting bears control over the USD/JPY.
Price action is favored to complete a breakdown below its resistance zone located between 109.919 and 110.276, as marked by the red rectangle. Adding to bearish developments is the move in the USD/JPY below its Fibonacci Retracement Fan trendline. Following a breakdown, a profit-taking sell-off is anticipated to close the gap to its ascending 38.2 Fibonacci Retracement Fan Support Level. The strong rally has made this currency pair vulnerable to an equally strong reversal. You can learn more about a breakdown here.
After the US and China signed the phase-one trade truce last Wednesday, doubts about it have immediately surfaced. Tariffs remain in place, the $95 billion in commodity purchases over two years are questionable, and the core issues remain in place. As more global economic data is awaited, a risk-off mood may follow due to disappointments. The USD/JPY is expected to descend into its short-term support zone located between 108.860 and 109.158, as marked by the grey rectangle. An extension of the breakdown sequence is possible.
USD/JPY Technical Trading Set-Up - Profit-Taking Scenario
Short Entry @ 110.150
Take Profit @ 108.900
Stop Loss @ 110.500
Downside Potential: 125 pips
Upside Risk: 35 pips
Risk/Reward Ratio: 3.57
A push in the Force Index above its ascending support level, which acts as temporary resistance, is likely to inspire a breakout attempt in the USD/JPY. The upside potential in this currency pair is limited to its next resistance zone located between 111.059 and 111.371. This would close a previous price gap to the downside, but the long-term bearish fundamental outlook makes more upside unlikely unless a major catalyst results in the change of existing conditions.
USD/JPY Technical Trading Set-Up - Limited Breakout Scenario
Long Entry @ 110.750
Take Profit @ 111.350
Stop Loss @ 110.500
Upside Potential: 60 pips
Downside Risk: 25 pips
Risk/Reward Ratio: 2.40


