Ripple’s XRP token sales plunged by 80% in the fourth quarter of 2019 to the lowest amount in three years. A majority of analysts and investors have repeatedly blamed the Ripple Foundation for the sharp sell-off in the XRP/USD due to the massive dumping of the tokens. The foundation defended those sales as a necessity to grow the ecosystem, pointing to sound demand from institutional clients. Price action in this cryptocurrency pair is now expected to resume its breakout sequence, as the major seller has stepped aside.
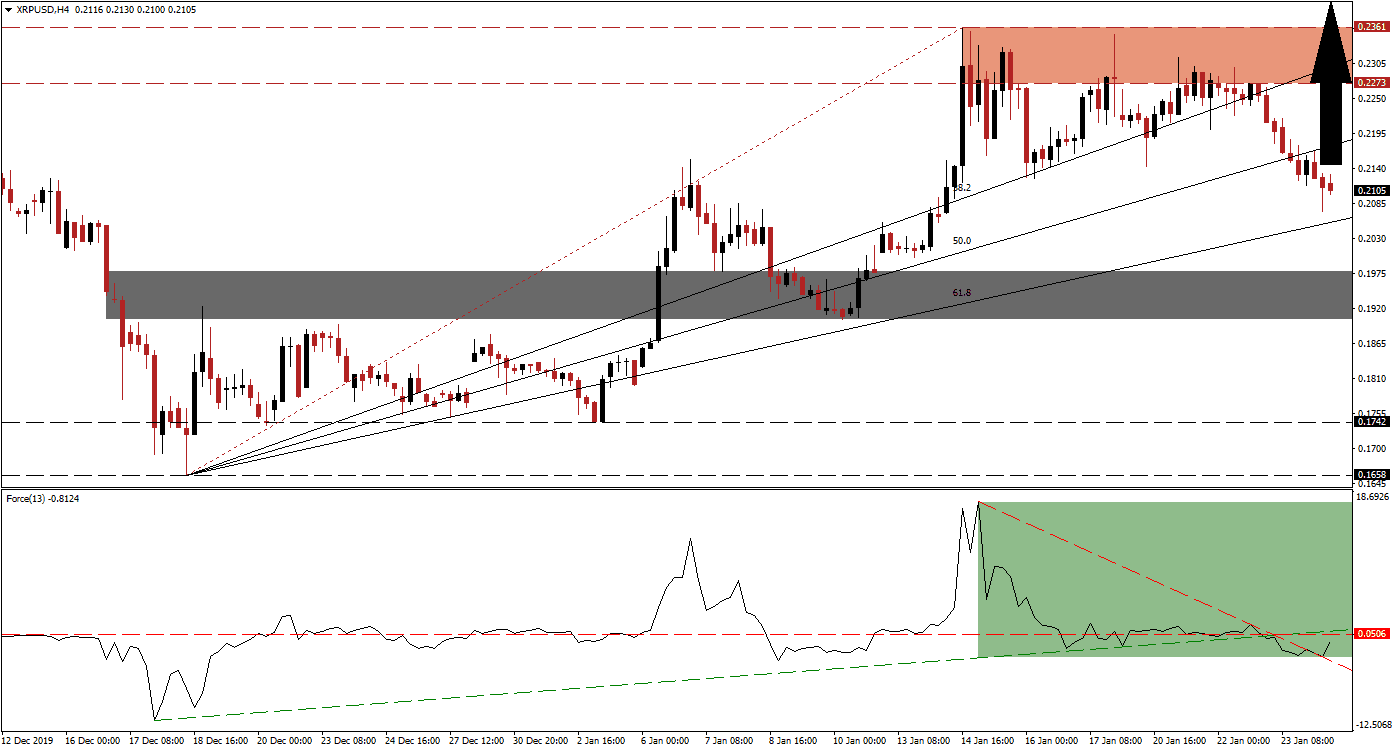
The Force Index, a next-generation technical indicator, indicates a recovery in bullish momentum. After a triple breakdown in the Force Index, it was able to push above its descending resistance level, as marked by the green rectangle. An extension of the recovery is anticipated to convert the horizontal resistance level into support, followed by a breakout in this technical indicator above its ascending support level. This will elevate it into positive territory and place bulls in charge of the XRP/USD. You can learn more about the Force Index here.
Price action is under the upside pressure provided by its ascending 61.8 Fibonacci Retracement Fan Support Level. This is favored to prevent a slide into its short-term support zone located between 0.1903 and 0.1978, as marked by the grey rectangle. The correction in the XRP/USD was a healthy development for the long-term bullish outlook and ensured the longevity of it. After the Ripple Foundation considerably slowed down it's selling of the XRP token in the fourth quarter of 2019, the first quarter of 2020 report will play a critical role for price action moving forward. You can learn more about the Fibonacci Retracement Fan here.
One important level to monitor is the intra-day high of 0.2154, the peak of a previous breakout that was reversed into its short-term support zone. A push above this level is likely to result in the next wave of net buy orders in the XRP/USD, which will drive price action into its resistance zone. This zone is located between 0.2273 and 0.2361, as marked by the red rectangle. Due to the bullish fundamental developments, a breakout is expected to elevate this cryptocurrency pair into its next resistance zone between 0.2569 and 0.2703.
XRP/USD Technical Trading Set-Up - Breakout Resumption Scenario
- Long Entry @ 0.2100
- Take Profit @ 0.2700
- Stop Loss @ 0.1900
- Upside Potential: 600 pips
- Downside Risk: 200 pips
- Risk/Reward Ratio: 3.00
In case of a breakdown in the Force Index below its descending resistance level, which currently acts as temporary support, the XRP/USD could extend its corrective phase. With the dominant bullish long-term fundamental outlook, supported by improving technical conditions, the downside potential appears limited. A violation of the short-term support zone is unlikely, but given the volatile nature of the cryptocurrency market, it cannot be ruled out. The next long-term support zone is located between 0.1658 and 0.1742.
XRP/USD Technical Trading Set-Up - Limited Breakdown Scenario
- Short Entry @ 0.1835
- Take Profit @ 0.1700
- Stop Loss @ 0.1900
- Downside Potential: 135 pips
- Upside Risk: 65 pips
- Risk/Reward Ratio: 2.08

