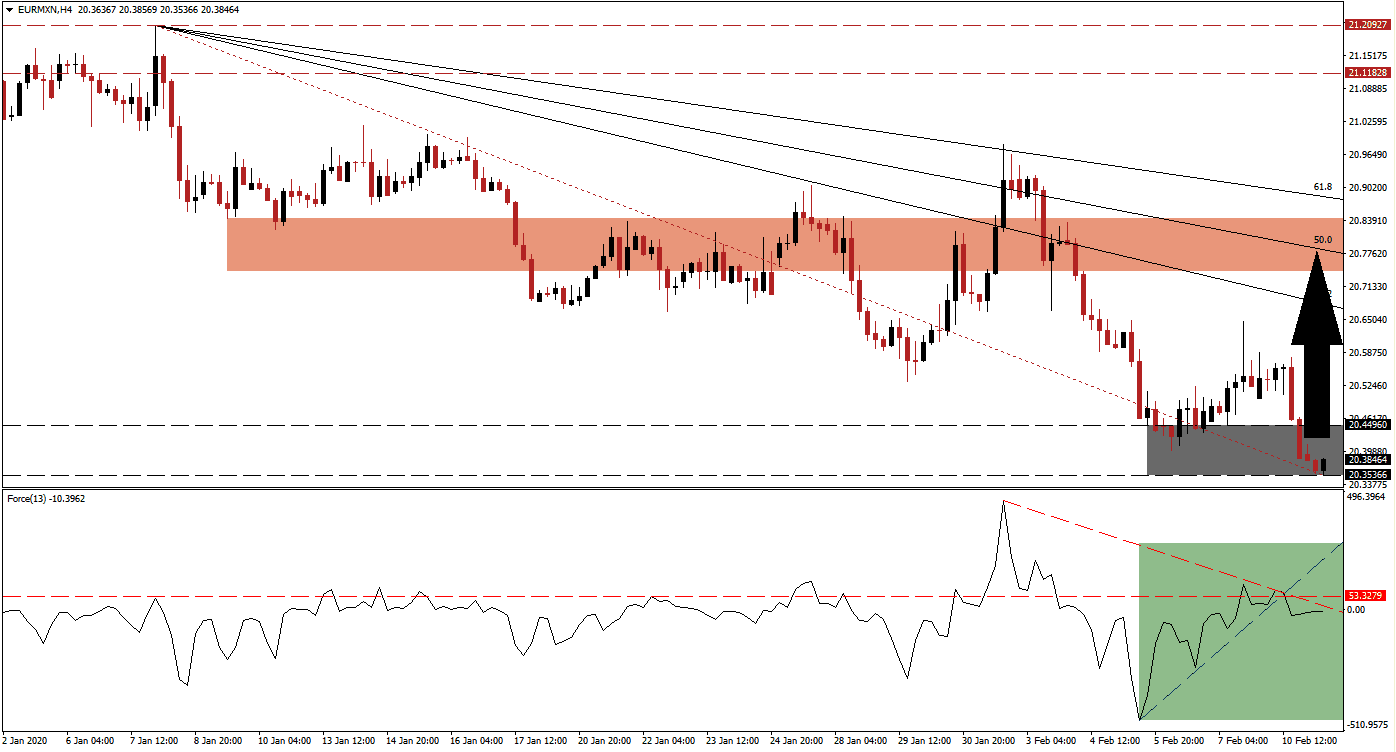
Mexico posted its first annualized economic contraction in a decade last year. It was minimal with an inflation-adjusted contraction of 0.1%, but it marked the fourth consecutive yearly slowdown. Despite the contraction in its 2019 GDP, there are bright spots in the Mexican economy. Exports rose by 2.3% while imports decreased by 5.1%, giving the country a trade surplus of $5.8 billion. The EUR/MXN found stability inside of its support zone, from where a minor recovery is favored to emerge.
The Force Index, a next-generation technical indicator, shows a recovery in bullish momentum, but bears remain in control of price action. The Force Index advanced, after recording a lower low, which initially took it above its horizontal resistance level, before reversing. It resulted in the formation of a descending resistance level, pushing this technical indicator below its ascending support level, as marked by the green rectangle. A double breakout is anticipated to lead the EUR/MXN into a breakout. You can learn more about the Force Index here.
A short-covering rally is expected to follow a breakout above its support zone located between 20.35366 and 20.44960, as marked by the grey rectangle. This should close the gap between the EUR/MXN and its descending 38.2 Fibonacci Retracement Fan Resistance Level. One critical level to monitor is the intra-day low of 20.53300, the low from where this currency pair accelerated into a temporary breakout above its short-term resistance zone. More net buy orders are likely to follow a move above this level. You can learn more about a short-covering rally here.
Price action is positioned to challenge its short-term resistance zone located between 20.74170 and 20.84296, as marked by the red rectangle. The 50.0 Fibonacci Retracement Fan Resistance Level is expected to end the recovery in this currency pair, with the long-term outlook suggesting more downside. German economic data continues to disappoint, pressuring the Euro, and giving the European Central Bank an excuse to continue its monetary experiment. This exposes the EUR/MXN to a fresh breakdown sequence.
EUR/MXN Technical Trading Set-Up - Breakout Scenario
Long Entry @ 20.38500
Take Profit @ 20.75000
Stop Loss @ 20.28500
Upside Potential: 3,650 pips
Downside Risk: 1,000 pips
Risk/Reward Ratio: 3.65
Should the Force Index be pressured to the downside by its descending resistance level, the EUR/MXN is favored to continue its corrective phase without a short-term interruption. A breakdown will take this currency pair into its next support zone, located between 19.93270 and 20.04981. The primary fundamental driver will be delivered by weak Eurozone economic data and ECB monetary policy.
EUR/MXN Technical Trading Set-Up - Breakdown Scenario
Short Entry @ 20.26500
Take Profit @ 19.93500
Stop Loss @ 20.38500
Downside Potential: 3,300 pips
Upside Risk: 1,200 pips
Risk/Reward Ratio: 2.75

